Introduction
Internet Association set out to research short-term rentals (STRs) in Seattle in order to contribute accurate, scientific data to the highly-charged issue. Short-term rentals are an oft-maligned bogeyman in the city’s housing debate, but there’s scant research on their actual impact.
There’s no doubt that the impacts of short-term rentals has been a subject of vigorous debate in Seattle as policymakers have been working on a regulatory framework to oversee the STR market. But before policymakers act, they should consider all the facts.
First, prior research indicates that STRs are a tiny percentage of the Seattle housing market. HomeAway estimates they represented less than 1 percent of the entire Seattle housing market between April of 2015 and 2016, for example.
Second, this study produces evidence that contradicts two of the most common assertions made by STR opponents. Internet Association found no statistically significant relationship between STRs and reduced owner-occupancy or increased commercial property listing activity. In fact, it appears to the find the opposite to be true: STRs may actually help Seattleites stay in their homes and reduce commercial property activity that would drive residents from their neighborhoods.
Finally, we found that STRs and hotels service geographically and economically distinct areas of Seattle. Our research found no evidence of hotels and STRs occupying similar markets in Seattle; they serve different communities at different price points.
STRs do enormous good for cities like Seattle and their residents. An Airbnb host in Seattle typically earns an extra $9,000 per year and nationally, 70 percent of HomeAway owners are able to cover at least half of their mortgage through rentals. Beyond these obvious first-order benefits, STRs tend to bring much-needed commerce and tourist spending to under-served neighborhoods. In fact, 60 percent of Airbnb users report that the extra income they received helped them stay in their homes.
More work certainly needs to be done in this area, but the results in this paper point us in the right direction. Available evidence tells us that short-term rentals are not the blight on housing markets they’ve been portrayed to be; in fact it appears the opposite is true.

Christopher Hooton, Ph.D.
Executive Summary
Purpose: This report seeks to empirically examine several claims used against short-term rentals (STRs) through a comprehensive empirical case-study analysis of the Seattle market. Specifically, the report examined two aspects: 1) the relationship of STRs with the residential housing market and 2) the relationship of STRs with the hotel market.
Findings: The report finds no evidence that STRs negatively impact either the residential housing market or commercial hotel market. Rather, case studies provide some initial evidence that STRs may support homeownership for individuals and families and lead to market creation in the area of accommodations. While these findings are encouraging, the authors recommend additional research on these matters.
Methodology: The report investigated several research questions related to purported claims by opponents of STRs. The following table presents each opponent claim, its corresponding research question(s) for this paper, and a summary of the findings for the respective analytical exercise.
| Purported argument against STRs | Corresponding Research Question | Analysis summary | Key Finding |
|---|---|---|---|
| ‘STRs cause higher rents forcing individuals out of their homes’ | Do STRs correlate with owner-occupancy and/or the number of vacant housing units? | STRs demonstrate positive correlation with owner-occupancy and negative correlation with housing vacancy. | Our research found initial evidence that STRs may actually help Seattleites stay in their homes, not force them out. |
| ‘STRs lead to an increase in commercial property listings that turn residential areas into de-facto hotels’ | Is there any correlation between the number of STR listings and commercial mortgages? | STRs are negatively correlated with both commercial mortgage applications and commercial mortgage originations. | Our research found that more STRs in Seattle corresponded with less commercial property listing activity. |
| ‘STRs are only in commercial areas of the city and don?t help local neighborhoods’ | What is the spatial structure of STR listings? | STR listings are highly diverse spatially with higher density outside of traditional hotel zones. | Our research found STRs appear all over Seattle, especially in areas underserved by hotels. |
| ‘STRs take away business from hotels, hurting the sector and its employees’ | What is the degree of coincidence between STR listings and hotel rooms? | There is very low degree of coincidence between STRs and hotels; out of 239 block groups in Seattle with STRs, only 35 also had hotels. | Our research suggests STRs serve different people and different markets than hotels. |
| Do the STR market and the hotel market have different spatial structures in their pricing? | There is no statistical evidence of similar spatial autoregressive price structures. |
Conclusion: There is no basis for restricting STRs based on any of the opposition claims examined. Rather, there is evidence that STR markets may safeguard home ownership by effectively providing revenue to local neighborhoods while also facilitating increased numbers of visitors thanks to a more geographically diverse accommodation market. Policymakers seeking to end the abuse of rental properties (of all types) should focus efforts on enforcing the existing regulations around: 1) the declaration of commercial investment properties in mortgages, 2) maintaining city property registers, and 3) the enforcement of existing licensing laws for landlords.
Introduction
Short-term rentals are a relatively new phenomenon and, consequently, there is little evidence on their impacts in the literature. This report seeks to address that gap by directly investigating several of the primary negative claims used by opponents of short-term rental services like Airbnb, Homeaway, and others to assess their validity. Our primary conclusion is that there is no empirical evidence to support any of the opponent claims investigated here in the Seattle market, and we suggest that policymakers more closely examine data when formulating policy around STRs and the sharing economy more broadly. Based on our analysis, we find that STRs provide a geographically diverse accommodation market with some initial evidence that they 1) help support owner occupancy of units, 2) provide a more spatially equitable distribution of accommodation revenue throughout a city, and 3) may create a new and unique demand.
The findings of this report are important because they directly address many of the arguments and claims used in the debate on the new sharing economy. While the authors recommend additional research on some of the analytical exercises, the findings provide a comprehensive empirical foundation of evidence on how STRs interact with the two most purportedly affected areas within an urban market: residential housing and hotel accommodations. With the former, we find no evidence of negative impacts on owner-occupancy or on commercial landlord activity – claims that STR listings saturate housing submarkets have no basis in the data given the spatial distribution of listings and their relationship with housing stock characteristics. With the latter, we find a very low degree of coincidence between STRs and hotels and no statistical evidence of encroachment by STRs into hotel markets. The primary takeaway, which mirrors other recent findings such as those of Hathaway and Muro1(2016), is that there is simply no evidence to support the primary opposition arguments to STRs.
Our primary conclusion is that there is no empirical evidence to support any of the opponent claims investigated here in the Seattle market.
We structured the report into two analytical sections on housing impacts and hotel market impacts. Section 2 lays out our analytical approach and general empirical strategy. Section 3 presents the methodology and results on our housing market analyses while Section 4 presents the methodology and results for our hotel market impact analyses. Section 5 concludes and offers a brief policy discussion.
Research Approach And Empirical Strategy
This report uses information for the city of Seattle in order to investigate a set of research questions concerning the impacts of STRs on housing and hotel markets within the city. Each research question corresponds to one or more popular opponent claims on the impacts of STRs in markets. Combined, they serve as an empirical foundation for future research into STRs and their impacts. Table 1 presents each of the claims investigated along with their respective research question(s).
Table 1: STR opponent claims and corresponding research questions
| Corresponding argument against STRs | Research Question | Analytical approach |
|---|---|---|
| ‘STRs cause higher rents forcing individuals out of their homes’ | Do STRs correlate with owner-occupancy and/or the number of vacant housing units? | Longitudinal analysis of housing stock characteristics and STR listings |
| ‘STRs lead to an increase in commercial property listings that turn residential areas into de-facto hotels’ | Is there any correlation between the number of STR listings and commercial mortgages? | |
| ‘STRs are only in commercial areas of the city and don?t help local neighborhoods’ | What is the spatial structure of STR listings? | Spatial econometric analysis of market pricing structures for STRs and hotels |
| ‘STRs take away business from hotels, hurting the sector and its employees’ | What is the degree of coincidence between STR listings and hotel rooms? | |
| Do the STR market and the hotel market have different spatial structures in their pricing? |
Source: Authors’ elaboration
The goal, and consequent research approach, of the report is to examine a breadth of issues through a single intensive case study rather than investigating a single analytical or policy issue through a breadth of observations. In other words, the aim is to provide a comprehensive look at a single market. The rationale of this approach is that it offers a better entry into the contentiousness of the debate on STRs by examining all (or at least most) of the primary points of argumentation with data and robust analysis. The authors hope that this report may offer methodological guidance for future research on additional markets and for more in-depth analyses of individual policy issues. More immediately, the authors hope that the findings will help inform and guide policymakers as they consider STRs and the sharing economy.
The city of Seattle was chosen for two primary reasons. First, it is a contentious market for the sharing economy broadly and for STRs specifically. Stakeholders from all sides are closely watching STR impacts and potential regulations on the market. The second reason is more practical and related to the availability of comprehensive data on STR listings, the housing market, and hotel markets within the city.
The analyses are grouped into two sets – one set on housing impacts and one set on hotel market impacts. For the former we used a longitudinal analysis with annual observations aggregated at a metropolitan statistical area level. For the latter, we analyzed listings with a booking in the 12 months ending December 1, 2015 aggregated at block groups.
Examining The Impact Of STRs On Housing
3.1 – Overview
Housing is understandably an issue of great importance to individuals and policymakers, which is why it is important for stakeholders to shape housing policies based on empirical evidence rather than unsubstantiated arguments. This section examines if and to what extent opposition claims against STRs are supported by empirical evidence in the Seattle market. Specifically, it examines claims that 1) STRs lead to an increase in individuals acting as commercial landlords via STR platforms and 2) STRs lead to a decrease in owner-occupancy.
To investigate these claims, we looked at two aspects of the Seattle housing market: 1) the relationship between short-term rentals and commercial landlord activity and 2) the relationship between short-term rentals and unit occupancy.
The report finds no evidence for these claims. Quite the opposite, the analysis suggests that STRs are negatively correlated with commercial landlord activity. Further, while causal relationships cannot be ascertained given the scope of analysis here, the evidence suggests that STRs may even support homeownership, acting as a stabilizing force in economic downturns by allowing individuals and families to capitalize on their assets and earn supplemental revenue.
3.2 – Methodology
We conducted a longitudinal analysis of Seattle’s housing market from 2006-2015 using annual observations for the metropolitan statistical area. It examined the following metrics over that period:
- Number of short-term rental listings
- Number of investment mortgage applications
- Number of investment mortgages originated
- Number of housing units (total)
- Number of owner-occupied housing units
- Number of renter-occupied housing units
- Number of vacant housing units
*All metrics were also examined as percent totals
Data were collected from the United States Census Bureau’s American Housing Survey, the United States Federal Financial Examination Council’s Home Mortgage Disclosure Act Aggregate Reports, and from public Internet Association member company data on short-term rentals in the Seattle metropolitan market.
Using these data, the report conducted a series of Pearson’s Product-Moment Correlation tests between individual metrics, which offers a test of the strength of the linear association of two variables. These tests were limited in scope and the report did not seek to establish full explanatory models of dependent variables. Rather, the analysis simply focused on establishing 1) whether a positive correlation between short-term rentals and investment activity existed (i.e. whether short-term rentals potentially lead to increased rental properties) and 2) whether a negative relationship between short-rentals and owner occupancy existed (i.e. whether short-term rentals potentially lead to a decrease in owner occupancy in housing). Had either of those relationships existed, additional modeling work would have been required to ascertain the causal effect of short-term rental units on each metric. Put differently, the analysis was looking for the existence of claimed relationships.
3.3 – Results
The analysis found that claims of these types of relationships have no basis in the Seattle metropolitan area. There was a negative relationship between short-term rentals and commercial property activity (as measured by investment property mortgage applications and approvals). There was a positive relationship between short-term rentals and owner occupancy.2Finally, STRs had a negative relationship with unit vacancy.
Far from being the source of great strain on residential housing markets, short-term rentals may provide residents an additional tool for obtaining and maintaining home-ownership.
While the report does not make causal claims because of its limited scope, the results do provide some initial evidence that, far from being the source of great strain on residential housing markets, short-term rentals may provide residents an additional tool for obtaining and maintaining home-ownership.
An a priori assessment would be that the access to additional income provided by short-term rentals allows residents to supplement income as needed depending on housing market conditions and broader metro area economic trends. This flexible additional income can be used to supplement incomes in economic downturns and to assist in rent or mortgage payments should they increase. For example, there was an increase in short-term rental activity in 2008 and 2009 during the height of the Great Recession, a reduction in listings from 2010 through 2013, and a stabilization of listings in 2013-2014 as the economic recovery stabilized and gained momentum. Results are presented in Table 2 and Figures 1-3.
Table 2: Correlation of short-term rental listings with housing metrics
| Housing Metric | Correlation with short-term rentals | p-value |
|---|---|---|
| Investment Mortgage Applications (% Total Mortgage Apps) | -0.4466 | 0.2282 |
| Investment Mortgage Applications (Count) | -0.7694 | 0.0153 |
| Investment Mortgages Originated (% Total Originations) | -0.6361 | 0.0655 |
| Investment Mortgages Originated (Count) | -0.7619 | 0.0170 |
| Owner Occupied Units (% Total Housing) | 0.0922 | 0.8135 |
| Owner Occupied Units (Count) | 0.4421 | 0.2335 |
| Vacant Housing Units (% Total Housing) | -0.0989 | 0.8002 |
| Vacant Housing Units (Count) | -0.1747 | 0.0653 |
Note: Correlation coefficients show the relationship from -1.0 to 1.0 between pairs of metrics with 1.0 being perfect positive correlation, -1.0 being perfect negative correlation, and 0 being no correlation. Negative correlations mean the pair of metrics move in opposite directions while positive relationships mean they move in the same direction. The p-values reported are for unadjusted standard errors and informational purposes only. P-values with 0.10 or less are significant at a 90% confidence level or higher.
[infogram id=”https://infogram.com/seattle___housing_units_by_type” prefix=”CzF”] [infogram id=”https://infogram.com/seattle___housing_units_by_type_” prefix=”FCN”] [infogram id=”https://infogram.com/seattle___investment_property_mortgage_applications_vs_short_term_rental_listings” prefix=”dnZ”]
Examining The Relationship Between Strs And Hotels
4.1 – Overview
One of the more contentious issues surrounding the emergence of the sharing economy has been its impact on established sectors and businesses, particularly through its market effects. Some analysts have claimed that the sharing economy enjoys the advantage of a looser regulatory structure over traditional firms. But to date there is not robust evidence of such an effect, while it is possible the sharing economy has actually enlarged the marketplace: a phenomenon called “market creation.” To investigate this debate, the report posed the following question: Do the STR listings and hotel accommodations have a different spatial structure of their pricing?
Some analysts have claimed that the sharing economy enjoys the advantage of a looser regulatory structure over traditional firms. But to date there is not robust evidence of such an effect.
Differences between these estimated spatial structures would provide evidence of market creation, in contrast to market capture by the new economy companies. The question is answered by mapping listings for STRs and hotels to determine the degree of coincidence between the two markets and then using a set of alternative spatial econometric approaches to investigate possible differences between spatial structures.
The results demonstrate: 1) a very low degree of spatial coincidence (geographic overlap) between STRs and hotels, 2) a geographically diverse distribution of STR listings, and 3) no statistical evidence of market capture by STRs of the hotel market.
The main takeaway is the lack of coincidence between both datasets, either by planning or market circumstances, which are beyond the reach of the econometrician to detect with the small samples compiled. This is perhaps more direct evidence that STRs and hotels cater to different markets.
4.2 – Analytical Problem
The market creation in the case of STRs is related to two particularities: a) its users prefer the intimate experience with the local realities of shared accommodations, in contrast to the more distant experience of the traditional accommodations (hotels); and b) many of its users could not generally have used the hotels’ service because of their prices.
As the two reasons imply preferences for pricing and location, we designed a test that emphasizes these two characteristics. We wanted to test the hypothesis that the sharing economy and hotel accommodations do not share the same spatial market, and by attending to different demand patterns, the sharing economy providers have created new markets, instead of merely capturing the existing ones. The hypothesis was spatially tested using two empirical strategies:
We assessed if the parameter of spatial association of the accommodations’ prices had the same sign and absolute value for both the sharing economy and hotel providers. In order to produce comparable parameters for both sets of data, the information was standardized so that the units of measure were strictly comparable in absolute values. In addition, as the two data sources differed in the number and location of the block groups with information, we developed the assessments for all the information first, and then developed block groups where both sources had information to allow a more direct comparison. The second strategy involved simultaneously using the block groups where both sources provided information as observations, and then testing the possibility of a difference due to the hotel characteristic using a dummy variable. This strategy allowed us to enlarge the dataset available when using the two sources of information, and their combination also offered a direct comparison.
In the first strategy, if the parameter was positive and significant in both regressions, and it was statistically different between them, we can argue that the two markets have different spatial structures, and consequently, there is market creation (in contrast to market capture). If the opposite held true, the two markets over-impose on each other, and short-term rentals are a substitute (market capture) for hotel accommodations.
In the second strategy, if the dummy variable for the hotels and its interaction with the spatial association parameter were significant, there is evidence of market differentiation. If only the first one was statistically significant, we have evidence of a different spatial structure, but not necessarily of the spatial association parameter. The second strategy still requires significance of the spatial association parameter, as it determines the existence of (or lack thereof) a spatial structure. Both sets of estimations will use the corresponding listings or count variable as control of the regression, a more robust regression setting.
4.3 – Methodology
We compiled information about prices and count of listings (or adverts) per block groups in the city of Seattle. The compiled information amounts to 235 block groups with shared economy short-term rentals and 54 block groups with hotel adverts (209 independent hotel adverts). For reference, there are 482 unique block groups in Seattle. However, only 35 block groups have information from both sources, which required small sample bias correction measures when used in regression settings.
A “standardized” spatial dependence parameter was produced by regressing the nightly price in standard deviations on the spatially weighted version of itself. This is called a SAR (Spatially Autoregressive) model. The spatial weighting has used a [0,1] standardized inverse distance matrix, where the maximum possible spatial relationship (1) is the shortest possible distance between block groups’ centroids. The SAR was estimated using both Full Maximum Likelihood (FML) and Bootstrap Errors, the first one is the standard technique in dealing with spatial correlation, while the second assesses the reliability of the estimation in presence of Small Sample Bias.
Two sets of econometric exercises were performed, first for both the independent full samples of block groups, then for the coincident small samples. This set tries to identify if the standardized SAR component of the two regressions was statistically different, implying a different spatial autoregressive structure, and consequently different markets. The second set of exercises was performed only on the coincident block groups. It used a dummy variable for the hotels and its corresponding interaction with the SAR, and it attempted to determine if the characteristic “hotel block group” had an impact on both the general regression and then the SAR parameter. A full description of the methodology is presented the Appendix.
The two sets of exercises are in general inconclusive, because Bootstrap regressions that deal with small sample bias show non-reliable SAR parameters. However, the second set of exercises seems to suggest different regression structures for both groups even in the Bootstrap setting. These sets of results, combined with the low degree of spatial coincidence between the two markets and the broader geographic distribution of STRs in the Seattle area (versus the concentrated nature of hotels), suggest that they are fundamentally different markets.
To conduct this analysis, we used two information sources:
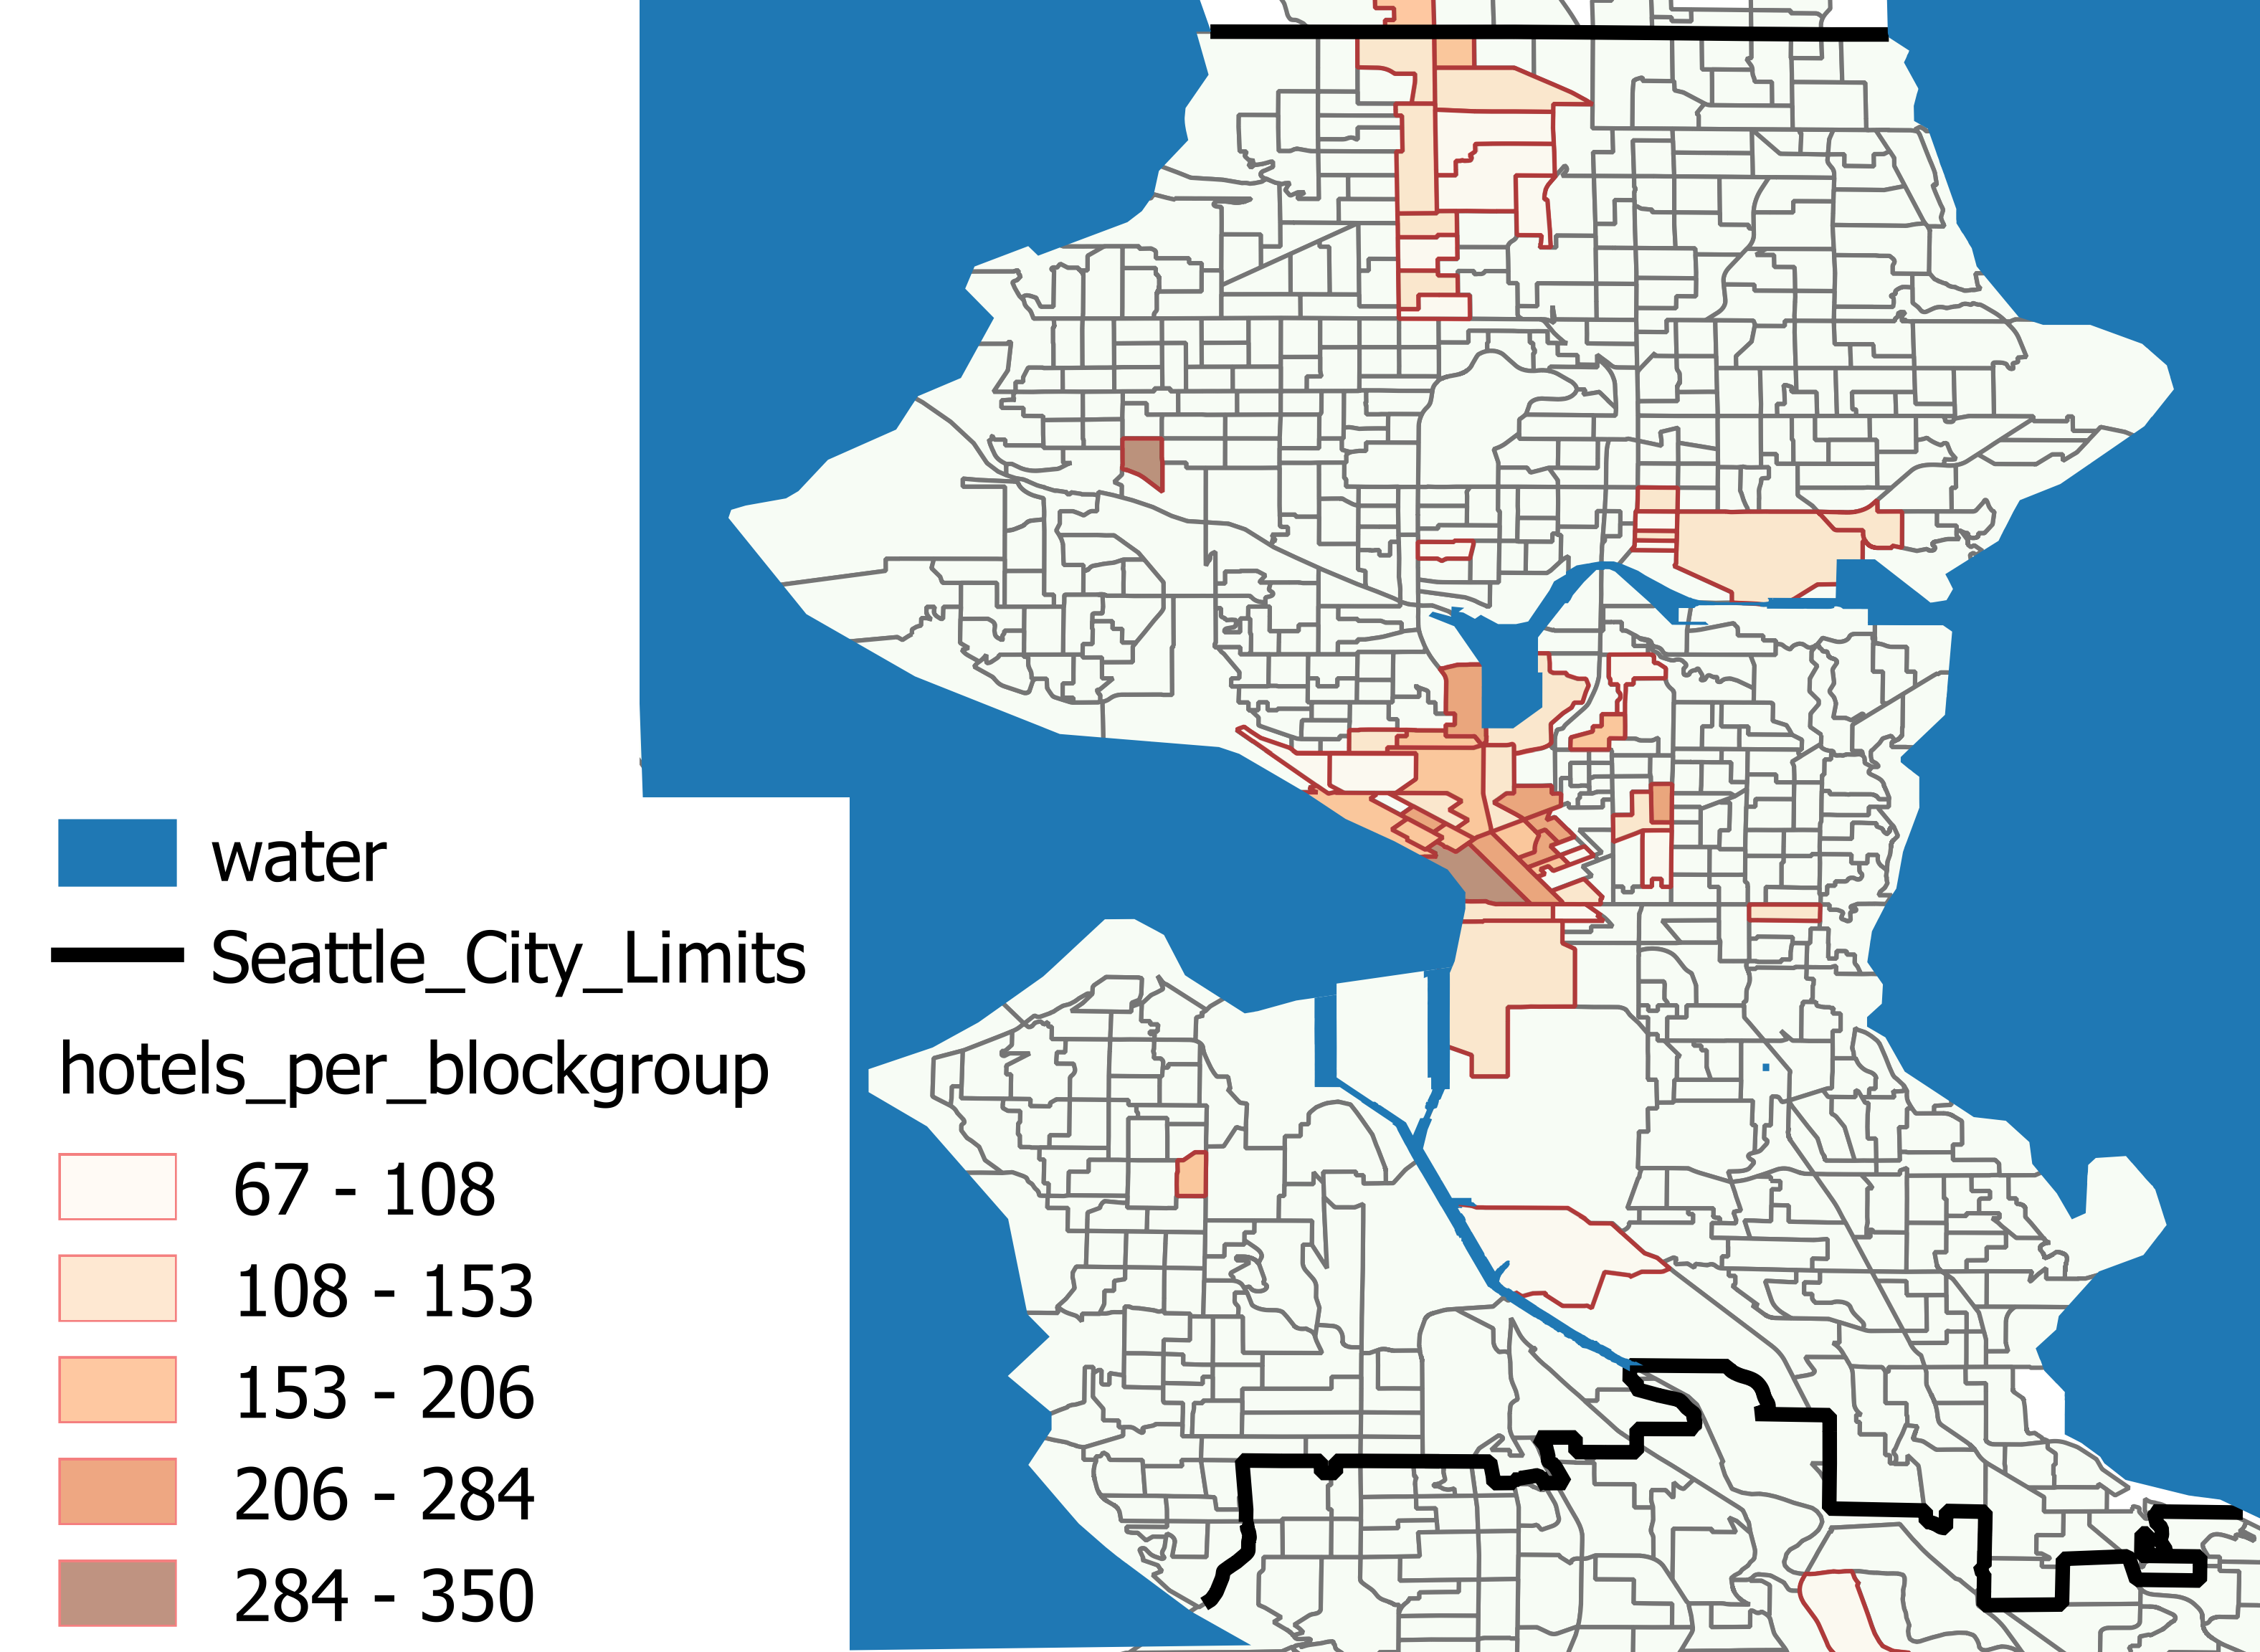
- 209 online hotel adverts collected by the author. All of them correspond to a low season, three months’ advance, 5 days stay. The search was made simultaneously from 10 different computers to avoid machine-tailoring of the demand, and the obtained nightly prices are reported in Map 1, while Map 2 reports the hotel count of observations per block group (only 54 block groups report at least one hotel advert).3
- Information on listings, prices, and occupancy for 239 block groups, delivered by the sharing economy companies. The count of listings per block group is reported in Map 3.4
The average nightly price for the hotels and the STRs are reported in Maps 4 and 5 correspondingly. We can appreciate that in the case of the hotels, the count and the average price are coincident, relatively higher in the downtown, with a radial distribution towards the peripheries. Although they are non-present in vast residential areas, there is a higher presence of hotels in the Aurora Avenue and University Districts.
Map 1: Price per night (US$) in advertised hotels (209 observations)
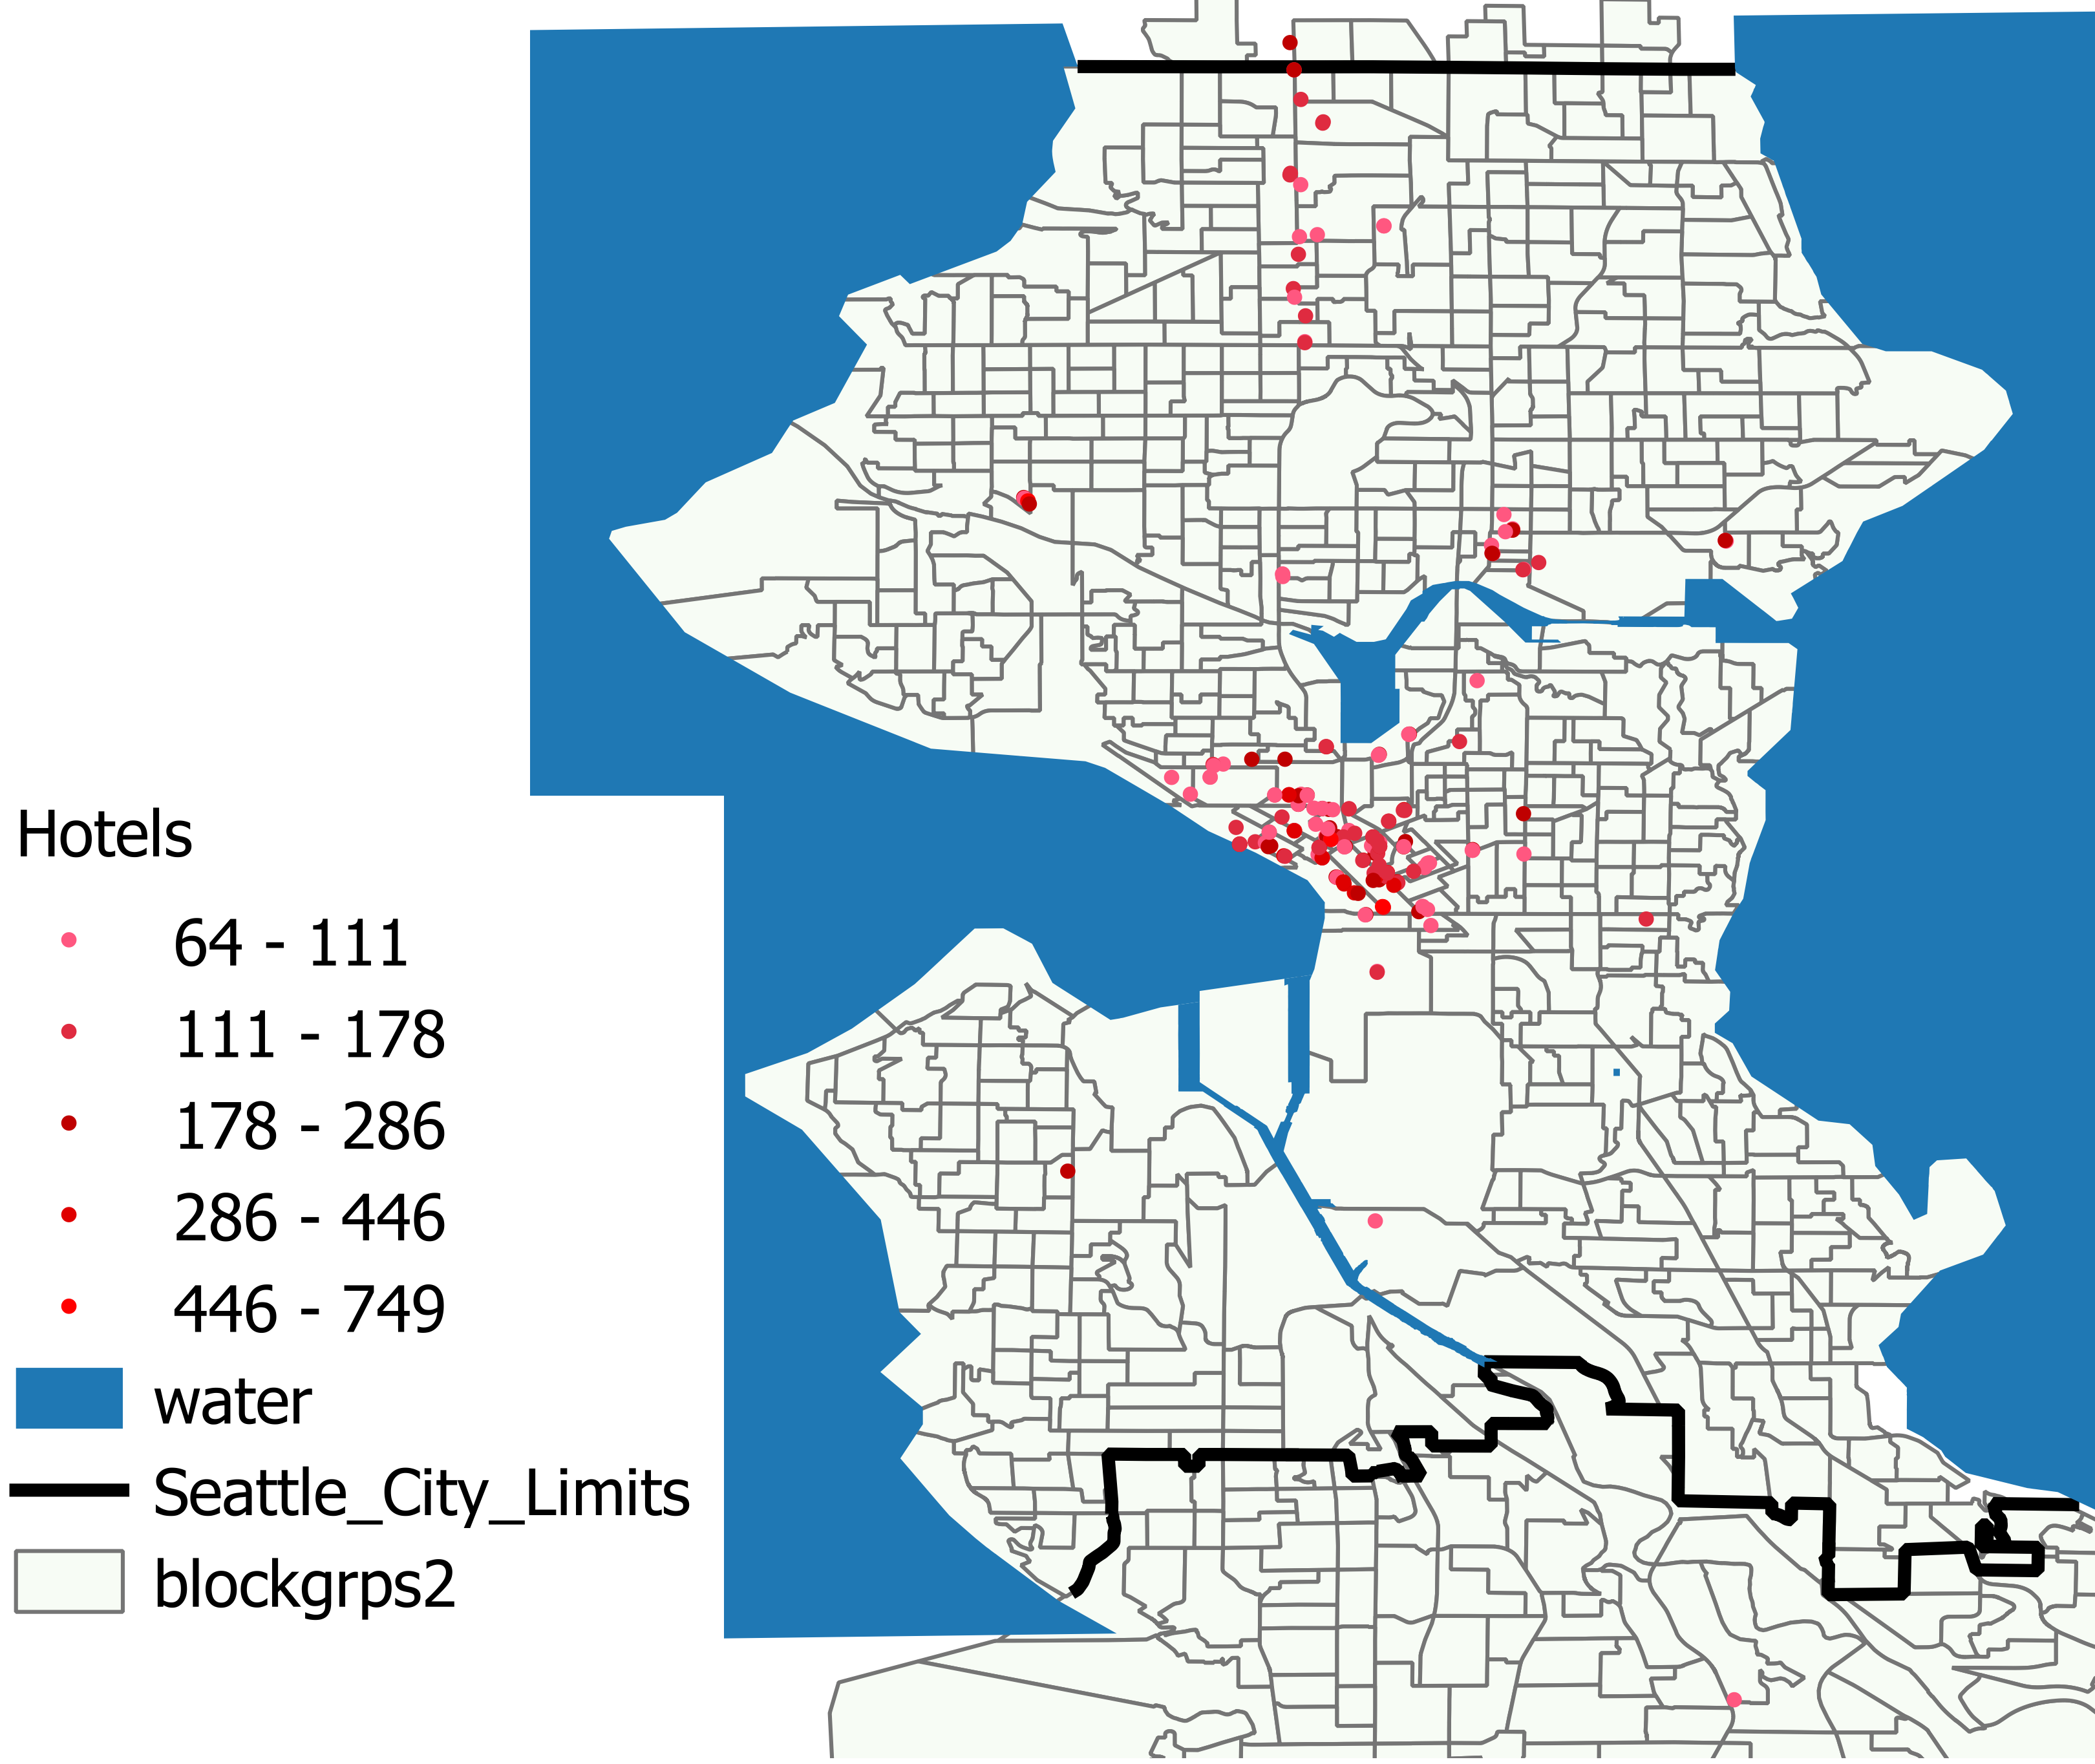
Map 2: Count of advertised hotels per block groups

Map 3: Listed shared accommodations per block groups
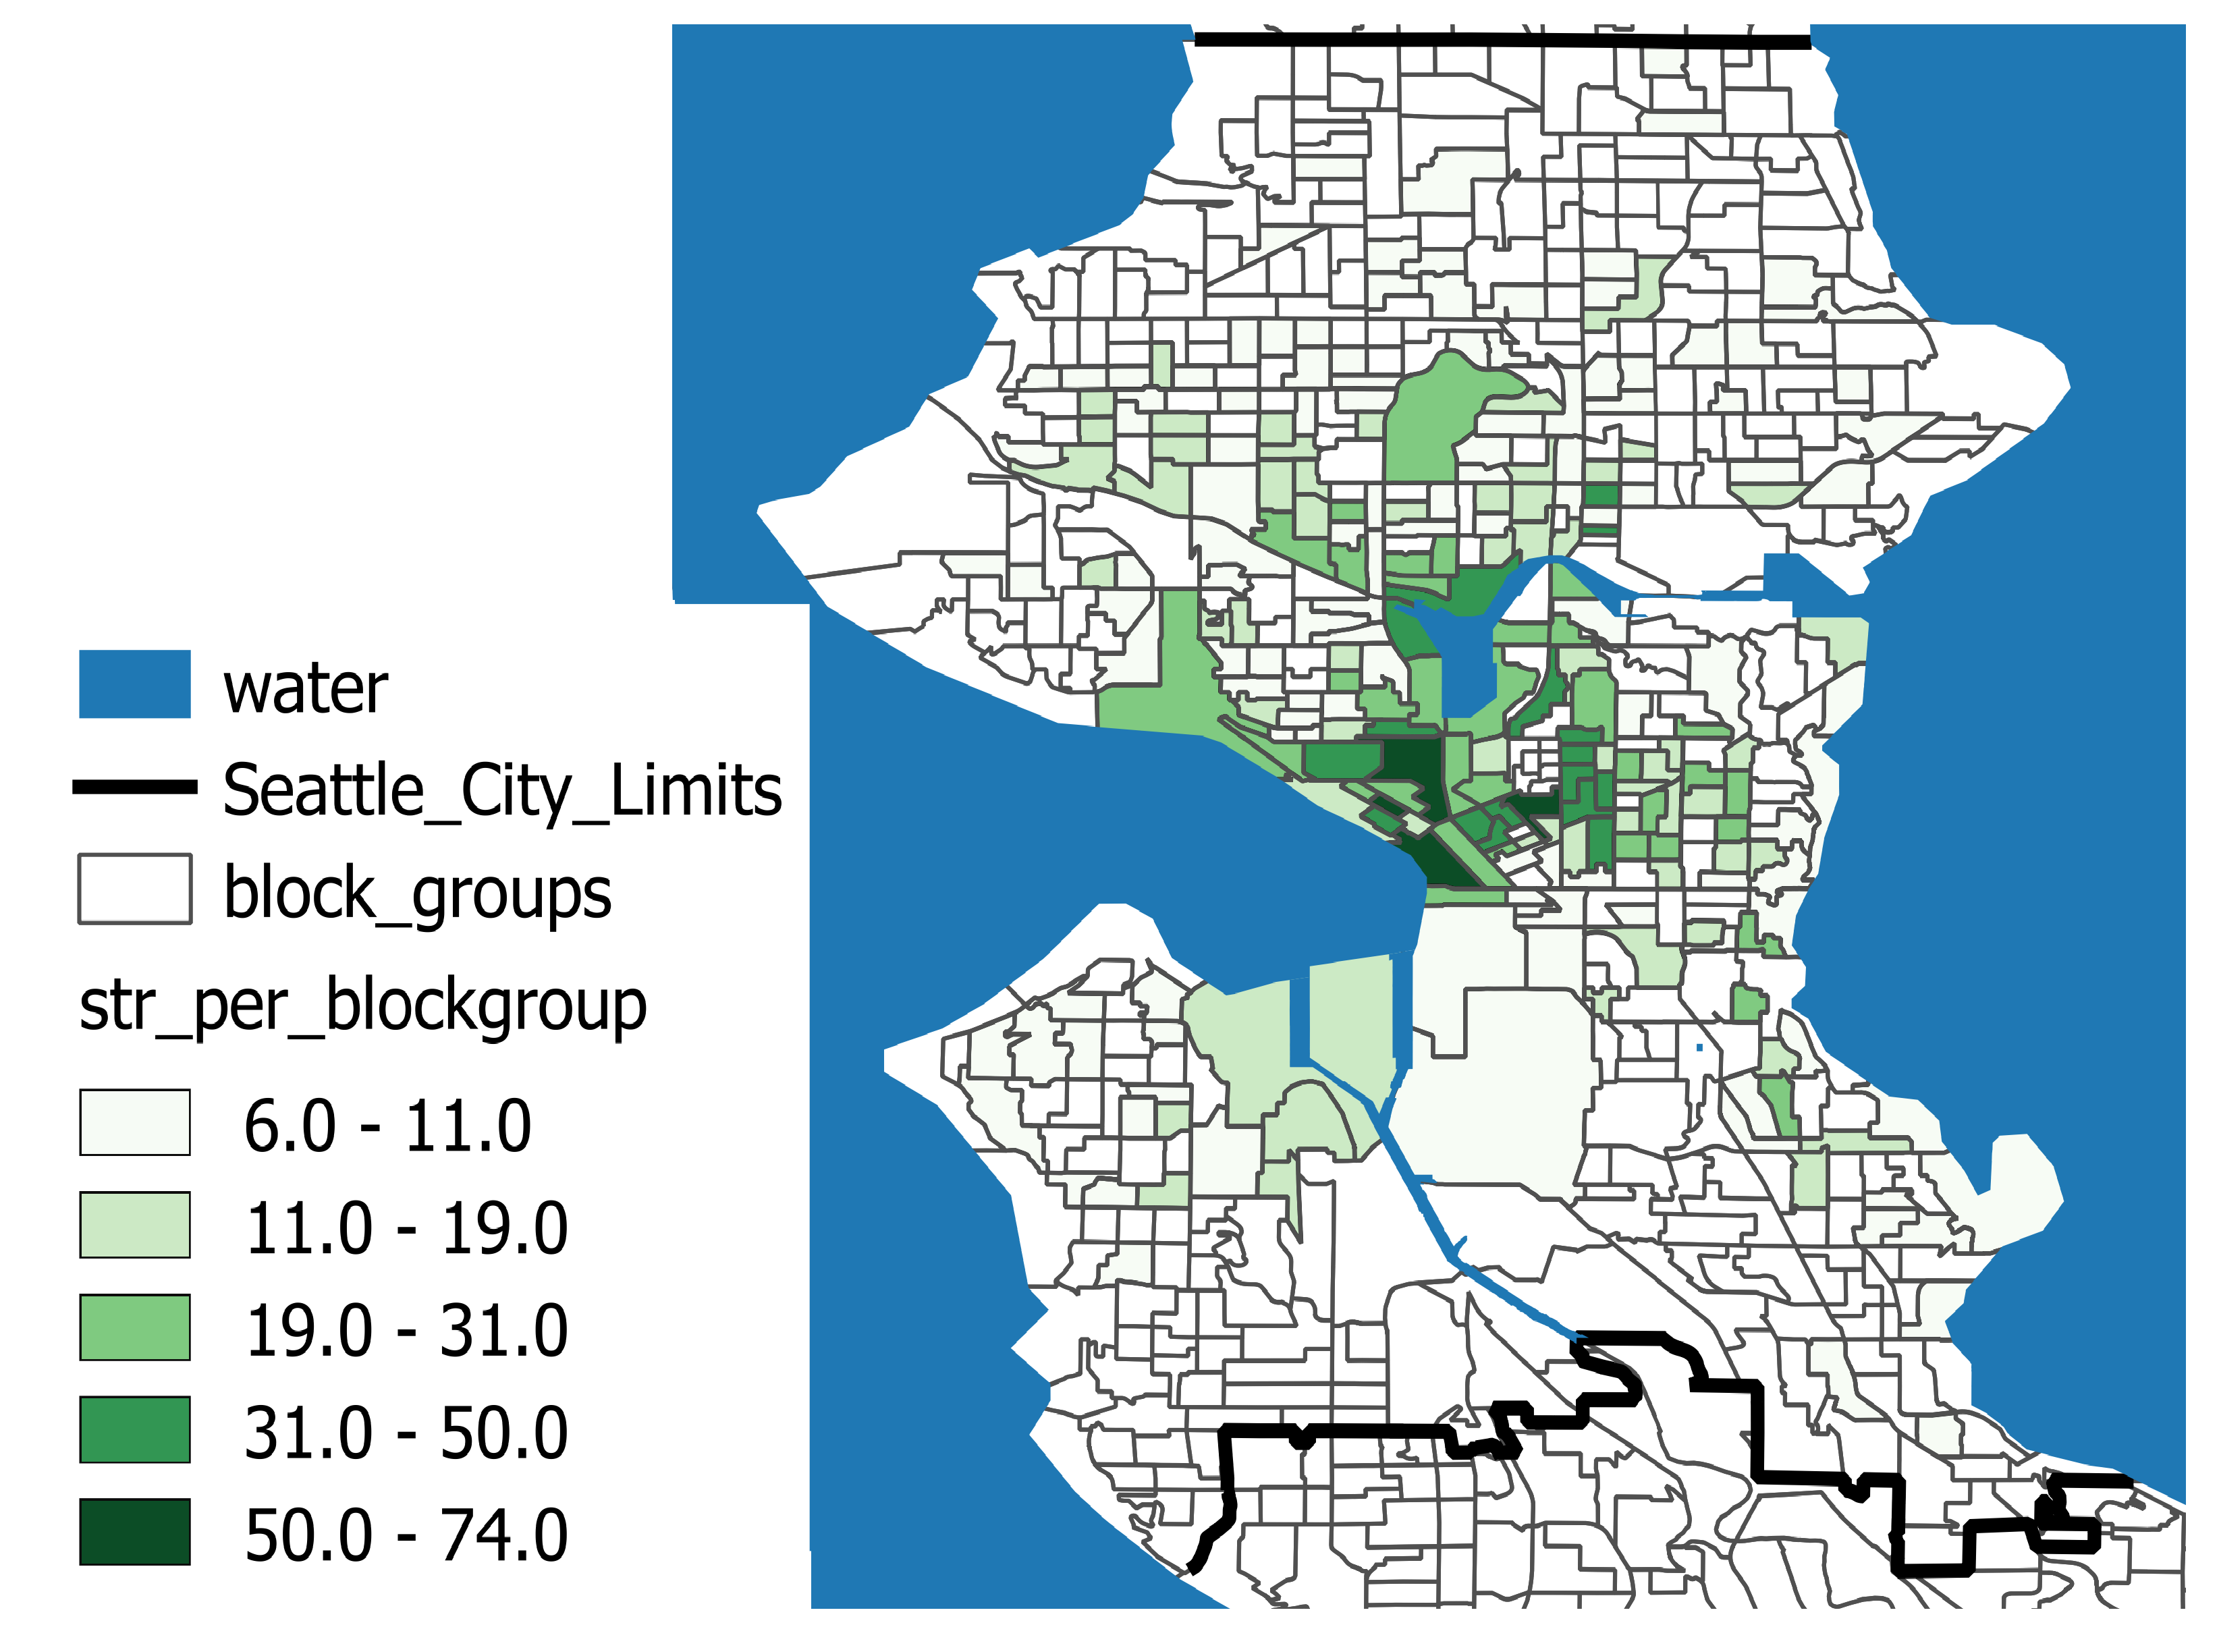
Map 4: Average nightly hotel price per block groups
In Map 5, the STR listings do not have the same spatial regularity. They are abundant in residential areas towards the north and east of downtown, almost non-existent on Aurora Avenue, and report higher prices in both the city center and purely residential sectors as Queen Anne and Ballard.
Map 5: Average shared accommodation nightly Price per block groups

We have then a situation where there is a low degree of coincidence between hotels and STRs per block group, with a different pattern of spatial distribution of the prices in both groups. Consequently, we expect a different spatial association parameter in the econometric results. Due to the low degree of coincidence (only 35 block groups; presented in Map 6), we will also use robust SE approaches to ensure statistical validity. The fact that both sources are basically located in different city sections might be due to either market or planning considerations – a hypothesis that we discuss below in the section of econometric results.
Map 6: Degree of coincidence between hotels and shared accommodations per block groups

4.4 – Results
Spatial comparison strategy. All the regressions presented in this report are performed in Standard Deviations, so that they are strictly comparable in absolute values. This strategy is preferable in our case to the most common use of logarithms, as in this last case there are still different absolute values despite offering an interpretation in terms of elasticities. The use of the variables in standard deviations brings them to a common unit of measure, which is crucial to compare the difference between estimated parameters.
In Table 3, we report the results for the sharing economy 239 block groups, where we have a positive and significant SAR component. In fact, there is a sizeable difference between the total and indirect effect of the SAR, which informs a complex set of spatial interrelationships, and a not robust estimate. Bootstrap errors have been applied with 100 repetitions and the absolute value of the SAR and its indirect effect, are significant and about the same in absolute value as the FML estimates.
In Table 4, we have the results for the 54 block groups with information. The SAR was not significant in both FML and Bootstrap estimations, even when using count control in the last specification. In fact, the Likelihood Ratio (LR) was not significant in the Bootstrap specifications, in contrast to always being significant for the sharing economy outputs of Table 3. We consider that this result must be due to the lack of observations, which affect the reliability of the spatial econometric output in presence of a cluster of high price observations in city center, and low priced hotel accommodations on Ballard Avenue.
Table 3: STRs — Dependent Variable: price per night (239 block groups)
| FML | Bootstrap | ||||
| Total Effect | Indirect Effect | Total Effect | Indirect Effect | SAR & Control | |
| Constant | -1.062* | -789 | -1.002* | -0.757 | -0.478 |
| SAR | 0.798*** | 0.387*** | 0.783*** | 0.382*** | 0.332*** |
| Listings | 0.142** | ||||
| Listings SAR | |||||
| Log-Likelhood | -316.613 | -319.185 | |||
| Akaike | 2.666 | 2.688 | |||
| Schwartz | 2.695 | 2.717 | |||
| R2 Adjusted | 0.128 | 0.114 | 0.134 | ||
| LR (p-value) | 0.000 | 0.000 | 0.000 | ||
*Significant at 90%; **Significant at 95%; ***Significant at 99%
Table 4: Hotels ? Dependent Variable: price per night (54 observations)
| FML | Bootstrap | ||||
| Total Effect | Indirect Effect | Total Effect | Indirect Effect | SAR & Control | |
| Constant | 0.057 | -0.039 | 0.705 | 0.045 | 1.646 |
| SAR | 0.464 | 0.263* | 0.386 | 0.229 | 0.016 |
| Count | 0.335** | ||||
| Count SAR | |||||
| Log-Likelhood | -75.008 | -74.176 | |||
| Akaike | 2.852 | 2.821 | |||
| Schwartz | 2.926 | 2.895 | |||
| R2 Adjusted | 0.002 | 0.016 | 0.039 | ||
| LR (p-value) | 0.260 | 0.151 | 0.092 | ||
*Significant at 90%; **Significant at 95%; ***Significant at 99%
The results using only the 35 block groups that are coincident between the sharing economy accommodations and the hotels are reported in Tables 5 and 6 respectively. As stated above, the use of standardized variables allows us to compare directly the absolute value of the SAR parameter (total and indirect) in these tables. However, SAR was not significant in the Bootstrap estimations of Table 3, consequently, we have to assess only the statistical significance of the difference between the parameters in the FML total and indirect effect estimates. The p-values for these tests were 0.399 and 0.398, indicating the same degree of spatial association for both datasets.
The fact that Bootstrap errors did not produce significant SAR estimates in Table 6, implies that there is a strong small sample bias due to the lack of coincident observations. Because of this we cannot make definitive statements at this spatial scale (with this number of observations).
Table 5: STRs for coincident block groups – Dependent Variable: price per night (35 observations)
| FML | Bootstrap | ||||
| Total Effect | Indirect Effect | Total Effect | Indirect Effect | SAR & Control | |
| Constant | -3.462 | -3.032 | -1.025 | -0.804 | -0.429 |
| SAR | 0.719** | 0.34** | 0.043 | 0.206 | 173 |
| Listings | 0.248 | ||||
| Listings SAR | |||||
| Log-Likelhood | -46.443 | -47.003 | |||
| Akaike | 2.768 | 2.800 | |||
| Schwartz | 2.857 | 2.889 | |||
| R2 Adjusted | 0.048 | 0.101 | 0.087 | ||
| LR (p-value) | 0.093 | 0.027 | 0.068 | ||
*Significant at 90%; **Significant at 95%; ***Significant at 99%
Table 6: Hotels results for coincident block groups ? Dependent Variable: price per night (35 observations)
| FML | Bootstrap | ||||
| Total Effect | Indirect Effect | Total Effect | Indirect Effect | SAR & Control | |
| Constant | -3.322 | -5.685** | -3.581 | -5.979* | -1.895 |
| SAR | 0.771* | 0.451*** | 0.792* | 0.464** | 0.202 |
| Count | 0.548*** | ||||
| Count SAR | |||||
| Log-Likelhood | -46.443 | -47.003 | |||
| Akaike | 2.768 | 2.800 | |||
| Schwartz | 2.857 | 2.889 | |||
| R2 Adjusted | 0.030 | 0.025 | 0.026 | ||
| LR (p-value) | 0.129 | 0.147 | 0.197 | ||
*Significant at 90%; **Significant at 95%; ***Significant at 99%
Treatment group comparison strategy. In this section, we follow the dummy test as presented in the methodological section above. Its set of results, presented in Table 7, offers a relatively similar picture to the one in Tables 5 and 6. The SAR estimate is positive and significant in most of the FML specifications, except when using Count (Listings) as a control in FML4. The same happened in the Bootstrap specifications when using the Count control in Bootstrap2. The hotels dummy was significant when used in the models FML2 and FML 4, but it was not significant in the model with the interacting parameter FML3. Furthermore, the dummy was significant in both Bootstrap regressions, even in the one with interacting parameter Bootstrap 2. However, we know that the spatial parameter was not significant in such case.
Table 7: Hotels Dummy and Interaction – Dependent Variable: price per night (70 observations)
| FML1 | FML2 | FML3 | FML4 | Bootstrap1 | Bootstrap2 | |||||||
| Total Effect | Indirect Effect | Total Effect | Indirect Effect | Total Effect | Indirect Effect | Total Effect | Indirect Effect | Total Effect | Indirect Effect | Total Effect | Indirect Effect | |
| Constant | -4.249 | -6.440*** | -2.942 | -4.048 | -3.464 | -5.273 | -1.936 | -3.036 | -1.922 | -2.164 | -0.566 | -1.285 |
| SAR | 0.908* | 0.51*** | 0.745* | 0.395** | 0.841* | 0.462*** | 0.596 | 0.324 | 0.568** | 0.285** | 0.386 | 0.211* |
| Hotels | -0.893*** | -0.662*** | 0.143 | 1.747 | -0.725*** | -0.549** | -1.027*** | -0.789*** | -0.774*** | -0.677*** | ||
| Hotels *SAR | -0.059 | -0.135 | ||||||||||
| Count | 0.222* | 0.202* | ||||||||||
| Log-Likelhood | -101.030 | -96.188 | -93.753 | -92.359 | -93.718 | -92.163 | -91.993 | -90.848 | ||||
| Akaike | 2.944 | 2.805 | 2.764 | 2.725 | 2.792 | 2.748 | 2.743 | 2.710 | ||||
| Schwartz | 3.008 | 2.870 | 2.861 | 2.821 | 2.920 | 2.876 | 2.871 | 2.838 | ||||
| R2 Adjusted | 0.167 | 0.180 | 0.191 | 0.200 | ||||||||
| LR (p-value) | 0.000 | 0.000 | 0.000 | 0.000 | ||||||||
*Significant at 90%; **Significant at 95%; ***Significant at 99%
In the results of the final test, presented in Table 7, once again we cannot definitively ascertain whether hotels and STRs share a single spatial market. There is some suggestion from the results of models FML2, FML4 and Bootstrap1 that this may be a possibility, but the most direct and precise test FML3 did not produce significant results. Also, the regressions change when introducing Count as regression control in specifications FML4 and Bootstrap2, further evidence of non-fully reliable results. Even when we extend the database to 70 observations in this exercise, the use of the count control proves the unreliability of the SAR estimates while the interaction of the SAR and Hotel Dummy has never been significant – these results apply for both the FML and Bootstrap results. All of this most likely is due to the lack of spatial coincidence as presented in Map 6.
4.5 – Conclusion
We have performed two sets of empirical tests examining the relationships of short-term rentals with 1) the residential housing market and 2) the hotel market in the city of Seattle. In the first set, we collected data on commercial investment mortgages (applications and originations) in the metro area as well as the composition of its housing stock from 2005-2016. We then conducted a series of Pearson’s Product-Moment Correlation tests between short-term rental listings and a variety of variables to examine their impacts of STRs on owner occupancy and vacancies. Using two sets of spatial econometrics exercises, we found no statistically conclusive evidence demonstrating the shared economy and hotels share the same markets in Seattle, or on the contrary, they serve different markets. The main problem found is the lack of coincident spatial information for both the shared economy and hotels sets of information, which required us to use bootstrap errors in order to detect any small sample bias in the FML estimations, when using full or only coincident samples of block groups. However, while the statistical evidence is inconclusive one way or another, the very low degree of spatial coincidence, the greater spatial diversity of STR listings, and some of the inconclusive statistical tests lead the authors to believe that STRs and hotels serve fundamentally different markets. In other words, STRs create demand rather than encroaching on hotel markets.
We found no statistically conclusive evidence demonstrating the shared economy and hotels share the same markets in Seattle.
What does this battery of tests and their findings imply? We argue two things.
First, while there are many claims around the negative impacts of STRs on local markets, there is little evidence in the literature to support those claims. Furthermore, when they are addressed systematically through empirical research, we find none of them hold up. There is no evidence of negative impacts from STRs (as claimed by opponents) in the Seattle market, and initial evidence showing that STRs help stabilize housing markets while boosting accommodation stays (aka tourism).
Second, it is critical that policymakers not succumb to unsubstantiated claims surrounding STRs and, rather, that they use the empirical evidence that does exist. Policymakers seeking to end the abuse of rental properties (of all types) should focus efforts on: 1) the enforcement of existing regulations around the declaration of investment properties in mortgages and to city property registers and 2) the enforcement of existing licensing laws for landlords. However, when they examine the empirical evidence, there is no basis for restricting STRs based on any of the opposition claims examined here.
The evidence suggests that STR markets may provide a safeguard for home ownership while increasing visitors through a more geographically diverse accommodation market – one which more effectively provides revenue to local neighborhoods. It would be a disservice for policymakers to work against these positive impacts simply because they haven’t seen the evidence.
Appendix — STR and hotel market analysis methodology
We try spatial econometrics specifications that consider the spatial association between observations’ variables. In this case, we are interested in the spatial association between the prices in different block groups in the city of Seattle. There are two prototype spatial models, the
Spatial Autoregressive Model (SAR):
yi= β1 + β2wi yi+ui
And the Spatial Error Model (SEM):
yi= β1 + β2 xi+β3wiei+ui
The SAR regresses a variable against itself spatially weighted , and has a iid u vector of errors, which do not necessarily satisfy non-autocorrelation, precisely because of being per definition autoregressive. The SEM regresses the same variable against the spatially weighted vector of errors of an OLS regression between it and another variable (or set of variables). The choice of anyone of these models is a purely empirical matter as the benchmark from which to add more variables or perform more analyses. In the present document, however, even when the SEM has the advantage of not having indirect (feedback) effects through its spatial weighting, it does not offer an absolute value spatial association parameter for the variable of interest (prices), consequently we use SAR and test its robustness by checking its indirect effects.
The second strategy introduced above requires us to fusion both available sources of information, each one of them with weighted by the same W matrix. A dummy variable equivalent to one (1) when a block group observations is for hotels, and zero (0) otherwise, is introduced and tries to identify different estimation structures, and an interaction between it and the SAR component will inform if there are differences of the estimated parameter:
yi= β1 + β2 wi yi+β3∙DummyHotel+ β4 (wi yi ui∙DummyHotel)+ ui
The spatial weighting process for any of the proposed tests involves the creation of a Spatial Weights Matrix , which relates one-to-one every spatial unit (block group) with its neighbors, or with the entire spatial system. In the present case, it is advisable to use a matrix of inverse distances, because the block groups with information have very different areas, plus they have a scattered distribution on the urban space.5The maximum distance possible between two block groups determines their zero (0) relationship, while their closest possible distance determines the relation one (1). All the other relationships lie in between these extremes, weighting the entire set of possible spatial relationships between block groups.
Finally, as the resulting database that has comparable information for the sharing economy and hotels per block groups will be very small, we used Bootstrap errors to determine if there is any “small sample bias”. Bootstrap makes multiple re-samplings and re-estimations of the parameters and standard errors of an OLS (or quintile) regression, if the changes in these values are significant, it means that the estimated parameters are not reliable due to the small sample bias.
- Hathaway, Ian and Mark Muro (2016). “Tracking the gig economy: New numbers.” Report. Brookings Institution.↩
- As well as with the total number of housing units, which counters suggestions that STRs reduce overall housing stock.↩
- Two hotels are located outside King County. They are included as they are close enough to be considered central Seattle.↩
- Note: While the report had data for all block groups, those with fewer than 6 listings were censored for privacy and are shown the same as blocks with no listings.↩
- That contrasts with a continuous spatial distribution that would require a spatial matrix where vicinity is determined by sharing borders↩