Executive Summary
Overview
Internet Association examined the economic contribution of the United States’ digital service exports in terms of export volumes and jobs supported by those exports.
Findings
- The U.S. digital service trade surplus was $172.6 billion in 2017, an increase of 5.6 percent from 2016
- The U.S. digital service trade surplus accounted for 68 percent of the total U.S. service trade surplus
- IA estimates that internet-enabled digital exports in 2016 supported approximately 161,000 internet sector jobs from $66 billion in exports and an additional 1.3 million jobs in other industries from $403.5 billion in potentially digital-enabled exports. That’s approximately 1.43 million jobs in total.
- These exports and jobs come from all 50 U.S. states.
Summary Table: U.S. ICT Service & Supported Jobs In 20161
| Digital Service Exports 2017* | Digital Service Surplus 2017* | ICT Service Exports 2016 | Potentially ICT-Enabled Service Exports 2016 | ||
|---|---|---|---|---|---|
| $ USD Billions | $ USD Billions | $ USD Billions | # Of Jobs | $ USD Billions | # Of Jobs |
| 439 | 172.6 | 66.1 | 161,000 | 403.5 | 1.43 million |
Methodology
Internet Association utilized government data on digital trade volumes and calculated the number of jobs supported through a methodology developed by ITA, which utilized National Employment Requirement Tables. IA produced state-by-state estimates through weights based on states’ overall service export volumes and overall internet sector productivity. IA calculated figures for the most recent data available, which was 2016.
Introduction
The United States is the global internet and digital content leader. Americans are enjoying a digital revolution that has led to amazing products, lower prices, and new jobs. We export all of this across the globe, with digital trade now accounting for nearly 70 percent of all U.S. services exports. And every sector of the economy benefits from this leadership.
That didn’t just happen. Existing U.S. law and policies are central to our digital success and leadership. Our technology leadership is the envy of the world, but depends upon – and was built by – the U.S. digital policy framework.
International trade in digital goods and services has increased steadily over the past 15 years, mirroring the rise of the internet as a major economic sector. Through both facilitation of ‘traditional’ products and through entirely new classes of goods and services, digital trade has become a quintessential component of the U.S. economy.
The Bureau of Economic Analysis (BEA) estimates that information communications technology (ICT) service exports (digital service exports) totaled approximately $70.9 billion and potentially ICT-enabled service exports (potentially digitally-enabled service exports) totaled approximately $439.1 billion as of 2017 (BEA, 2017). In 2016, the totals were approximately $66.1 billion and potentially ICT-enabled service exports totaled approximately $403.5 billion (BEA, 2016). The most recent national requirement table is from 2016 and, therefore, IA can only calculate jobs figures from 2016 and not 2017.
The analysis and evidence presented in this report, the first of its kind to estimate the number of jobs supported by digital trade, demonstrates that these exports directly contributed approximately 161,000 jobs to the U.S. economy and up to 1.43 million jobs in 2016. Furthermore, 60 percent of these jobs are in ‘traditional’ industries that the internet has helped bolster in recent years and they are found in every U.S. state. Simply put, digital trade is a quintessential part of the internet sector’s success and the overall American economy.
Trade In The 21st Century
Digital trade is defined as commerce in “products and services delivered via the internet” (USITC, 2013). Economists at the U.S. Economic Statistics Administration describe ICT service exports as, “services that can be delivered almost instantaneously online at a relatively small cost” (Nicholson, 2016a). This is unique from ICT goods, which require ‘physical delivery’.
The current paper works under the assumption (and Commerce Department guidance) that ICT service exports and potentially ICT-enabled service exports are generally the same as digital exports.2 While not completely synonymous and likely insufficient in their comprehensiveness, these two metrics offer an accepted starting point for understanding how digital trade impacts America’s economy and its labor force.
The USITC (2013b) calculated that as of 2011, digital trade from the U.S. added between approximately $517 to $710 billion to our GDP from exports of approximately $63.2 billion in ICT services.3 Since 2011, ICT service exports have increased by 4.6 percent and, since 2013 (the oldest year available), potentially ICT-enabled service exports have increased by 6.2 percent (see Figure 1). That contribution represents from a favorable position for the United States – a trade surplus of $24.2 billion in ICT service exports and $159.5 billion in potentially ICT-enabled service exports as of 2016. In 2017, that combined surplus totaled approximately $172.6 billion.
Fig 1. U.S. Digital Exports, 2006-2017

Source: Author’s elaboration; data from US Bureau of Economic Analysis
There are clear measurement issues related to the use of national account and other national productivity metrics that many economists believe cause undercounting in digital economy metrics. Digital trade figures are no exception, meaning that there is a strong likelihood that the full picture of digital trade has yet to be captured. It is beyond the scope of the current paper to offer a full discussion on these issues, but it’s important to point out for readers. National data methods aside, the digital trade in services metrics of BEA demonstrate strong growth over the period between 2006-2017.
The Benefits Of Digital Trade
All industries — and businesses of all sizes — reap the rewards of our digital leadership. Small businesses and entrepreneurs in every state and every community use the internet to sell and export across the globe. Internet-connected small businesses are three times as likely to export and create jobs, grow four times more quickly, and earn twice as much revenue per employee. Digital trade is not simply about the internet industry. The data from BEA demonstrate a positive picture for the general economy from digital exports, both for the U.S. and other digital exporters.
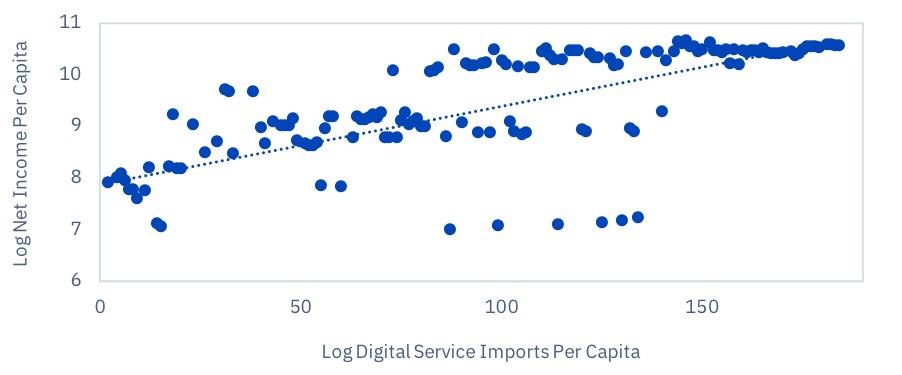
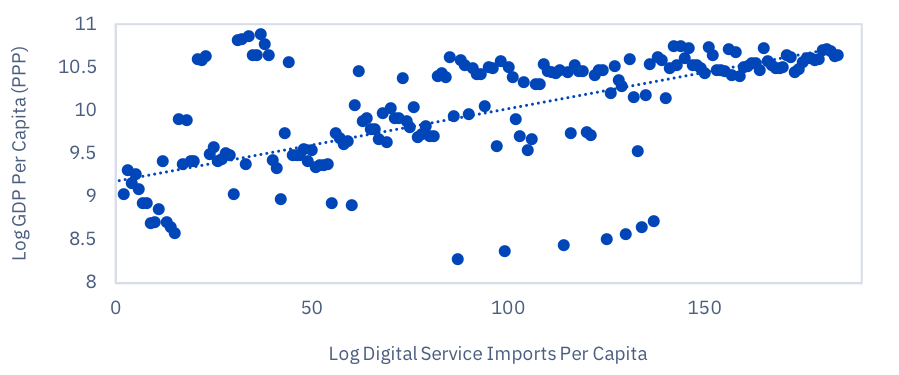
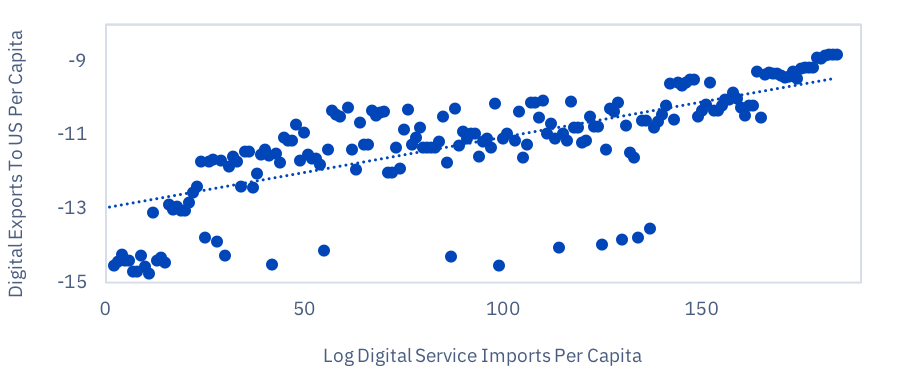
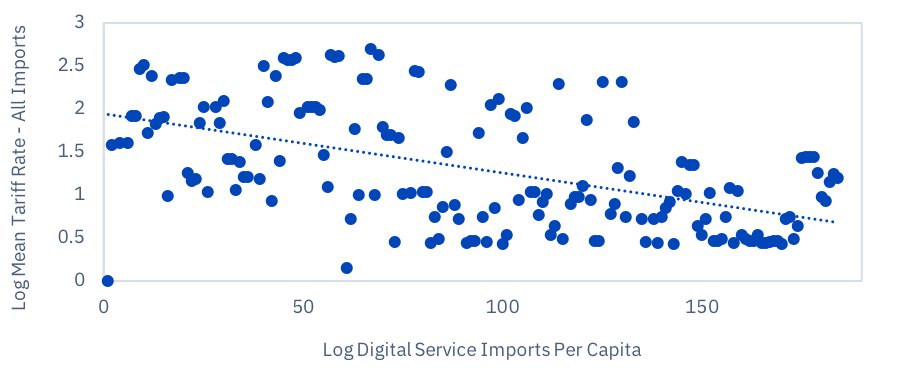
The paper demonstrates this utilizing paired annual estimates for 2006 through 2015 to compare digital service exports from the United States to other countries globally and digital service imports to the United States from its trading partners (respectively) with general economic indicators.4 Specifically, the paper compares these metrics with net income per capita and GDP per capita (PPP) as well as with mean tariff rate and with each other (exports with imports) in Figures 2 and 3.
The simple analysis shows there are strong positive correlations between digital trade and the economic welfare of a country. The figures also show a positive correlation of digital imports and exports indicating the two are likely complementary, while higher tariff rates reduce digital trade, as expected. There are, of course, limited conclusions that can be drawn from this exercise,5 but the correlations do seem to confirm the general economic benefits of digital trade. This simple documentation alone is an important step.
Fig 2. ICT Service Exports From The United States
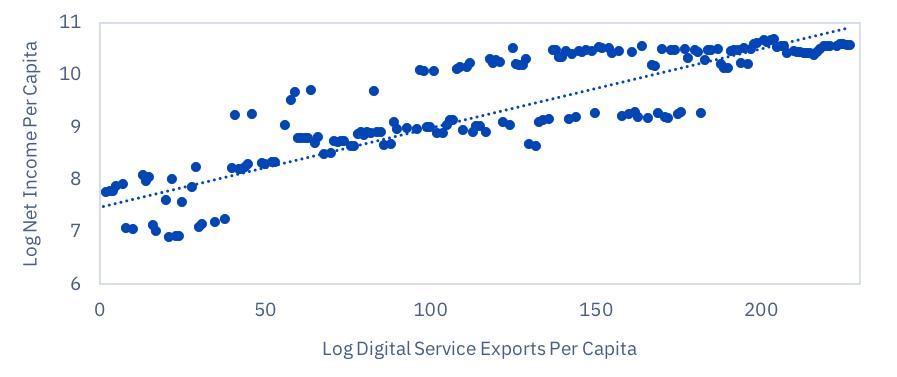
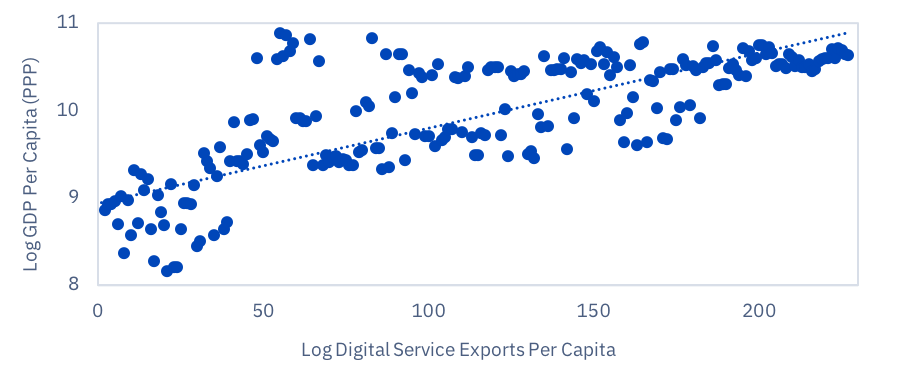
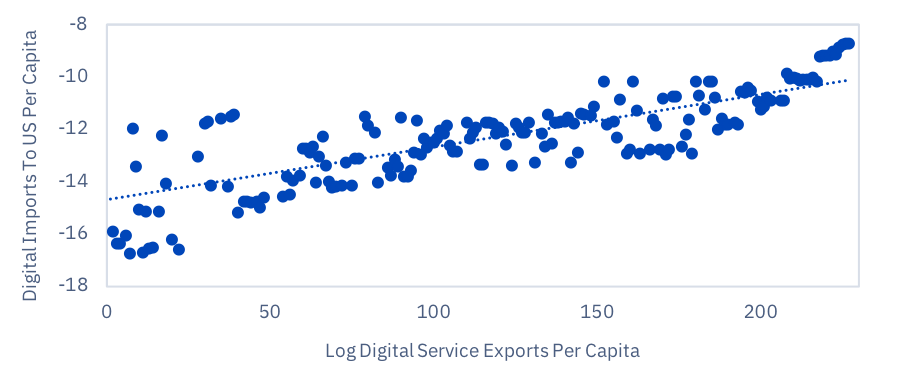
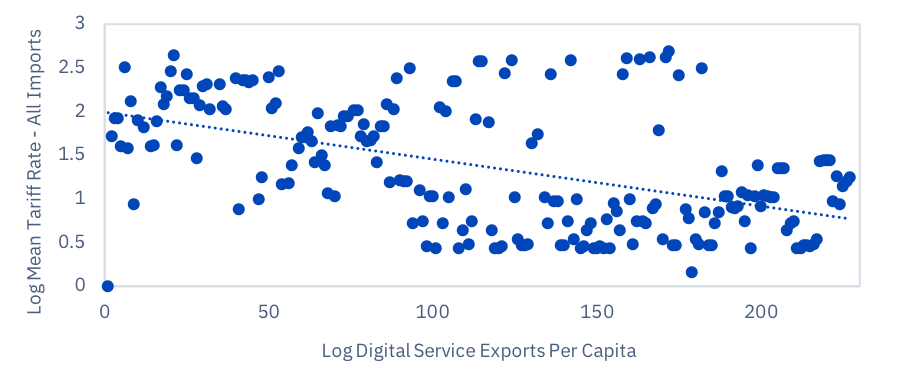
Fig 3. ICT Service Imports Into The United States
Digital Exports And Jobs
The volume of digital trade is clearly significant and the benefits of it are readily apparent , but current measurements remain largely abstract. Furthermore, they may simply lead to more questions around who benefits from digital trade. To make the figures more appreciable and in an attempt to better answer those questions, the paper turns to measuring the jobs created in the U.S. by digital trade.
The paper utilizes a methodology developed by the International Trade Administration (ITA) in the U.S. Department of Commerce (see Rasmussen, 2016) to calculate jobs supported by U.S. digital exports. First, the paper identifies the appropriate industry codes for the internet sector according to IA’s core identification methodology in the National Employment Requirement Tables.6 Second, the paper calculates the aggregate multiplier (for the number of jobs supported by output/export volume) for the internet industry. The paper also calculates the internal multiplier (i.e. that which applies to jobs created within the internet industry directly) and the external multiplier (i.e. that which applies to indirect jobs created without the internet industry in ‘traditional’ industries). The paper assumes that ICT service exports correspond to the internal multiplier and that potentially ICT-enabled service exports correspond to the external multiplier.7
Using this approach, the paper estimates that 161,000 American jobs come from U.S. digital exports while approximately 1.4 million additional jobs come from potentially ICT-enabled service exports in 2016. Table 1 summarizes.
Table 1: U.S. ICT Service & Supported Jobs In 2016
| ICT Service Exports 2016 | Potentially ICT-Enabled Service Exports 2016 | |||
|---|---|---|---|---|
| $ USD Billions | # Of Jobs | $ USD Billions | # Of Jobs | |
| Total | 66.1 | 161,000 | 403.5 | 1.43 million |
Finally, the paper also produces estimates for the digital exports of each state in the U.S. using a weighting index based on overall service exports and internet sector productivity in each state. The paper presents estimates for digital service exports and jobs supported by those exports in Table 2. These are the first state-by-state digital trade estimates.
Table 1: U.S. ICT Service & Supported Jobs In 2016
| ICT service export volume estimate (000,000s) | Potential ICT exports volume estimate (000,000s) | ICT service exports – supported jobs estimate (000s) | Potential ICT exports – supported jobs estimate (000s) | |
|---|---|---|---|---|
| Alabama | $822 | $5,019 | 2.0 | 17.8 |
| Alaska | $174 | $1,063 | 0.4 | 3.8 |
| Arizona | $1,108 | $6,766 | 2.7 | 24.0 |
| Arkansas | $419 | $2,559 | 1.0 | 9.1 |
| California | $8,868 | $54,120 | 21.6 | 191.6 |
| Colorado | $954 | $5,823 | 2.3 | 20.6 |
| Connecticut | $830 | $5,065 | 2.0 | 17.9 |
| Delaware | $228 | $1,394 | 0.6 | 4.9 |
| District of Columbia | $178 | $1,087 | 0.4 | 3.8 |
| Florida | $3,092 | $18,870 | 7.5 | 66.8 |
| Georgia | $1,991 | $12,150 | 4.8 | 43.0 |
| Hawaii | $173 | $1,060 | 0.4 | 3.8 |
| Idaho | $215 | $1,312 | 0.5 | 4.6 |
| Illinois | $2,690 | $16,419 | 6.5 | 58.1 |
| Indiana | $1,260 | $7,689 | 3.1 | 27.2 |
| Iowa | $556 | $3,397 | 1.4 | 12.0 |
| Kansas | $548 | $3,345 | 1.3 | 11.8 |
| Kentucky | $949 | $5,796 | 2.3 | 20.5 |
| Louisiana | $1,470 | $8,975 | 3.6 | 31.8 |
| Maine | $175 | $1,070 | 0.4 | 3.8 |
| Maryland | $1,000 | $6,102 | 2.4 | 21.6 |
| Massachusetts | $1,352 | $8,251 | 3.3 | 29.2 |
| Michigan | $2,014 | $12,295 | 4.9 | 43.5 |
| Minnesota | $1,025 | $6,259 | 2.5 | 22.2 |
| Mississippi | $455 | $2,781 | 1.1 | 9.8 |
| Missouri | $919 | $5,610 | 2.2 | 19.9 |
| Montana | $105 | $643 | 0.3 | 2.3 |
| Nebraska | $327 | $1,998 | 0.8 | 7.1 |
| Nevada | $451 | $2,753 | 1.1 | 9.7 |
| New Hampshire | $239 | $1,459 | 0.6 | 5.2 |
| New Jersey | $1,895 | $11,564 | 4.6 | 40.9 |
| New Mexico | $229 | $1,398 | 0.6 | 5.0 |
| New York | $4,600 | $28,071 | 11.2 | 99.4 |
| North Carolina | $1,460 | $8,910 | 3.5 | 31.5 |
| North Dakota | $166 | $1,016 | 0.4 | 3.6 |
| Ohio | $2,149 | $13,115 | 5.2 | 46.4 |
| Oklahoma | $409 | $2,500 | 1.0 | 8.9 |
| Oregon | $737 | $4,497 | 1.8 | 15.9 |
| Pennsylvania | $2,205 | $13,456 | 5.4 | 47.6 |
| Rhode Island | $166 | $1,015 | 0.4 | 3.6 |
| South Carolina | $1,076 | $6,568 | 2.6 | 23.3 |
| South Dakota | $115 | $704 | 0.3 | 2.5 |
| Tennessee | $1,292 | $7,887 | 3.1 | 27.9 |
| Texas | $8,560 | $52,238 | 20.8 | 184.9 |
| Utah | $583 | $3,559 | 1.4 | 12.6 |
| Vermont | $132 | $806 | 0.3 | 2.9 |
| Virginia | $1,531 | $9,342 | 3.7 | 33.1 |
| Washington | $2,913 | $17,777 | 7.1 | 62.9 |
| West Virginia | $256 | $1,565 | 0.6 | 5.5 |
| Wisconsin | $978 | $5,973 | 2.4 | 21.1 |
| Wyoming | $76 | $465 | 0.2 | 1.6 |
Note: Jobs estimates rounded to nearest 100; estimates produced for 2016, rather than 2017, because of the year of observation for IA’s internal weights, which the author used to produce these estimates.
Conclusion
Economists and trade proponents have too often ignored the very real impacts of the opening of borders and other traditional industries to global markets. However, it is crucial that we do not blindly apply historical lessons to industries of the future without consideration of evidence. The internet industry in the U.S. enjoys a massive competitive advantage and is a driving force of the U.S. economy. Consequently, it produces a strong, positive trade balance for the U.S. and helps other industries thrive.
This paper offers the first estimates for the number of jobs supported by digital exports from the U.S. and the first estimates on a state-by-state basis. The evidence shows that the approximate $440 billion in digital service exports from the U.S. creates over 1.4 million jobs. Further research must be done, but this report has laid a groundwork considering the limitations in data. In the interim, the evidence in this paper should serve as proof to policymakers that an open trade environment is crucial to U.S. jobs, the U.S. economy, and U.S.digital industries.
America is the global internet and digital content leader and this leadership helps create jobs. The U.S. must actively promote this policy framework and diligently defend our digital laws at home and abroad to ensure future success.
Bibliography* And Works Cited
*Digital barrier literature review and documentation conducted by Yuxuan Huang for Internet Association.
- Aaronson, Susan Ariel and Rob Maxim. 2013. Trade and the internet policies in the US, EU, and Canada. November 10, 2013.
- Bauer, Matthias, Hosuk Lee-Makiyama, Erik van der Marel, and Bert Verschelde. 2014. The Costs of Data Localization: Friendly Fire on Economic Recovery. ECIPE Occasional Paper No. 3/2014. European Centre for International Political Economy.
- Blum, Bernardo S. and Avi Goldfarb. 2006. Does the internet defy the law of gravity? Journal of international economics, 70(2):384–405.
- Borchert, Ingo, Batshur Gootiiz, and Aaditya Mattoo. 2014. Policy barriers to international trade in services: evidence from a new database. The World Bank Economic Review, 28(1):162–188.
- Bureau of Economic Analysis. 2017. Table 3.3 U.S. Trade in ICT and Potentially ICT-Enabled Services, by Country or Affiliation. International Data, Interntional Services Table.
- Bureau of Labor Statistics. 2017. Employment Requirements Matrix, Employment Projections. United States Department of Labor.
- Burri, Mira. 2015a. Designing future-oriented multilateral rules for digital trade. Edward Elgar Research Handbook on Trade in Services. (Edward Elgar, 2015).
- Burri, Mira. 2015b. The international economic law framework for digital trade. Zeitschrift für Schweizerisches Recht, 135:10–72.
- Burri, Mira. 2016. The world trade organization as an actor in global internet governance.
- Ciriani, Stephane. 2015. The economic impact of the european reform of data protection. Communications & Strategies, (97):41–58.
- Fefer, Rachel F., Shayerah Ilias Akhtar, and Wayne M. Morrison. 2017. Digital Trade and U.S. Trade Policy. CRS Report. 7-5700. Congressional Research Service.
- Fergusson, Ian F, Mark A McMinimy, and Brock R Williams. 2015. The trans-pacific partnership (tpp): In brief.
- Freund, Caroline and Diana Weinhold. 2002. The internet and international trade in services. The American Economic Review, 92(2):236–240.
- Gomez-Herrera, Estrella, Bertin Martens, and Geomina Turlea. 2014. The drivers and impediments for cross- border e-commerce in the eu. Information Economics and Policy, 28:83–96.
- Hauser, Heinz. 2003. Der sardinenfall und das potenzial des tbt-abkommens. WTO-News, (8):3–4.
- Humphrey, John, Robin Mansell, Daniel Par´e, and Hubert Schmitz. 2004. E-commerce for developing countries: Expectations and reality. IDS bulletin, 35(1):31–39.
- Information Technology & Innovation Foundation (ITIF). 2016. Testimony of Robert D. Atkinson, Ph.D. Founder and President Information Technology and Innovation Foundation Before the Committee on Ways and Means Trade Subcommittee Hearing on “Expanding U.S. Digital Trade and Eliminating Barriers to Digital Exports”
- Internet Association. 2016. National Trade Estimate Report Comments on Digital Trade Barriers. October 2016. Internet Association.
- Kshetri, Nir. 2008. Barriers to e-commerce and competitive business models in developing countries: A case study. Electronic commerce research and applications, 6(4):443–452.
- Lawrence, Japhet Eke, Usman A Tar, et al. 2010. Barriers to e-commerce in developing countries. Information, society and justice journal, 3(1):23–35.
- Liu, Cynthia. 2010. Internet censorship as a trade barrier: a look at the wto consistency of the great firewall in the wake of the china-google dispute. Geo. J. Int’l L., 42:1199.
- Nagle, Luz E. 2001. E-commerce in latin america: Legal and business challenges for developing enterprise. Am. UL Rev., 50:859.
- Nicholson, Jessica. 2016a. ICT-Enabled Services Trade in the European Union. Issue Brief #03-16. Economics and Statistics Administration, United States Department of Commerce. August 31, 2016.
- Nicholson, Jessica. 2016b. New BEA Estimates of International Trade in Digitally Enabled Services. Economics and Statistics Administration, United States Department of Commerce. May 24, 2016.
- Rasmussen, Chris. 2016. Jobs Supported by Exports 2015: An Update. Office of Trade and Economic Analysis. International Trade Administration. Department of Commerce. April 8, 2016.
- Rotchanakitumnuai, Siriluck and Mark Speece. 2003. Barriers to internet banking adoption: a qualitative study among corporate customers in thailand. International Journal of Bank Marketing, 21(6/7):312–323.
- Kurnia, Sherah. 2006. E-commerce adoption in developing countries: an indonesian study.The University of Melbourne, 111.
- United States International Trade Commission (USITC). 2013. USITC Publication 4415, Digital Trade in the U.S. and Global Economies, Part 1.
- United States International Trade Commission (USITC). 2014. USITC Publication 4485, Digital Trade in the U.S. and Global Economies, Part 2.
- Wunsch-Vincent, Sacha and Arno Hold. 2012. Towards coherent rules for digital trade: Building on efforts in multilateral versus preferential trade negotiations. Trade governance in the digital age, pages 179–221.
- This report previously stated totals for “total digital service exports” and “digital service trade surplus” that summed together ICT-enabled service exports and potential ICT-enabled service exports. These figures should not have been summed together as potential ICT-enabled service exports includes ICT-enabled service exports. The correct totals are approximately $439 billion in digital service exports and a surplus of $172.6 billion for digital service trade balance. The previous, incorrect figures were $470 billion in digital service exports and $196.1 for for digital service trade balance.↩
- The focus of IA in the current paper is on digital services, rather than goods. IA knows that the internet facilitates digital trade in goods with a strong portion coming from companies in the internet industry. However, given the inability to distinguish in government datasets between goods trade from internet companies versus traditional companies using the internet, IA focuses on the conceptually ‘cleaner’ service metric.↩
- Data for potentially ICT-enabled service exports extends back only to 2013.↩
- For example, the paper pairs U.S. ICT service exports in 2010 with Net Income Per Capita in 2010.↩
- The technological sophistication inherent in digital services clearly implies that they will be concentrated in developed economies. The positive correlation in income measures and digital service exports is expected and does not reveal much in terms of the relative benefits of digital trade among developed countries or how digital trade barriers may affect those benefits.↩
- At the time of writing, the most recent employment requirement matrix table was for 2016 data. Consequently, while trade export data were available for 2017, the author was unable to calculate jobs supported for 2017.↩
- To clarify, the combined multiplier for the internet sector industries is approximately 6.0. This means that for every $1 million of exports from the U.S. in these industries, approximately 6 jobs are directly supported. Using the NER matrix, approximately 40 percent of the multiplier applies to the internet industries themselves (the internal multiplier portion) while approximately 60 percent applies to non-internet industries, such as trucking (the external multiplier portion).↩