“The people around this table, in the telecom industry, invest more in the United States of America than any other industry since 2007. Getting this right continues that kind of investment,” Stephenson said. “In fact, this industry invested through the financial crisis and downturn, invested right through that cycle, and we came out the back end leading the world in mobile broadband technology. So, it’s an exciting time and we’re very appreciative of you putting this together.” June 22, 2017 Meeting between White House and tech industry leaders
Introduction
How has net neutrality affected businesses and consumers? Despite the speculation, there is no evidence of any harms as a result of net neutrality rules (NN). Rather, NN has allowed for success in both the telecommunication sector and edge services. Consumers, competition, investment, capacity, and innovation. Behind all the noise surrounding net neutrality (NN), the debate boils down to these issues, each surrounded almost exclusively by theoretics (Haas, 2007). The present report attempts to address this gap by injecting data and empirical evidence into the discussion with the goal of moving beyond the noise. Part of a pair of papers from Internet Association,1 this report helps to address the hypothesized effects of NN on the economy. The conclusion is strong evidence supporting the continuation of this vital policy and a clear lack of negative harms from approximately seven years of either de jure or de facto NN rules in the United States and strong evidence supporting the continuation of this policy. To the contrary, net neutrality has not only allowed for a healthy telecommunication sector, but has helped to fuel the extraordinary innovation, economic growth, and job creation in the technology sector that has become a pivotal engine of the American economy. Most fundamentally, using a variety of techniques and direct industry data, the paper finds no evidence of economic harm as a result of NN – neither as a result of the FCC’s Open Internet Order of 2010 nor the agency’s 2015 NN rules. More specifically, the paper finds the following:
- No negative impact on telecom infrastructure investment, broadband infrastructure investment, or cable infrastructure investment – utilizing a variety of techniques and checks, the paper finds no slowdown in investment in the USA compared to other OECD countries and no causal impact overall from the FCC policies on investment
- No capacity or bottlenecking issues for the telecommunications industry – as reflected by production prices below those of the late 1990s/early 2000s
- No evidence of industry harm – aggregate corporate net income and equity have increased steadily since approximately 2008
- No impact on industry innovation by telecom providers – as reflected by a sharp and consistent rise in capacity, speeds, and patents
- Clear evidence of benefits to consumers from NN
More broadly, the paper illustrates that a robust open Internet, supported by enforceable NN rules fosters innovation in the internet sector and protects consumers from harmful discriminatory pricing2. Indeed, substantial evidence of innovation, economic growth, and job creation confirms unequivocally that a robust, enforceable NN environment is critical for fostering innovation in the internet sector and the U.S. economy more broadly. Net neutrality perpetuates the virtuous circle in the broadband internet access space and is the bedrock for a new generation of American businesses and jobs.
Understanding Net Neutrality
There is copious literature on NN3 and the issues are well known. Briefly, arguments in support of NN emphasize the prevention of anti-competitive practices and the positive effects of a fair playing-ground for businesses in all sectors (Wu, 2006a; Greenstein et al., 2016). Economides and Tag (2012) offer an effective and succinct summary of these, compiling them into a set of six primary arguments for supporting NN rules:
- Negative harms to consumers and non-Internet Service Provider (ISP) businesses due to the introduction of last-mile two-sided pricing4;
- Discriminatory pricing arrangements with content producers;
- Discriminatory pricing approaches based on business and consumer segment;
- Creation of capital barriers for market entry of content firms;
- Anti-competitive delivery practices where ISPs prioritize their own content;
- Reduction in online transactions due to application of multiple fees for network access
Arguments opposing net neutrality theorize harms to the telecommunications sector, particularly disincentives that affect investments and innovation, and consumer benefits through tiered package offerings that differentiate consumer demand. More specifically, it has been claimed that NN rules will lead to a 1) reduction in investment incentives for telecom infrastructure and innovation by network providers, 2) network capacity issues due to increased consumption of content, and 3) improved consumer surplus. Put differently, some argue that without NN, ISPs can price and or quality discriminate allowing for more profit, which would lead to higher incentives to invest in infrastructure. However, this discrimination might negatively affect the content providers’ incentives to invest in developing new services, suggesting that NN might need to be imposed. (Litan and Singer, 2007; Choi and Kim, 2010; Cheng et al., 2011). Models, theory (economic and legal), and hypotheses abound on both sides of the issue.5 Yet, there are two facets of the literature set that define it. First, much of the research dates back between several years to over one decade, meaning the conversation merits an update, particularly given that important NN rulings were implemented in 2010 and 2015 after much of it had already been written. The years between 2010 and 2015 led to de facto net neutrality rules and, consequently, provide researchers convenient trigger dates for analysis. The second important characteristic of the NN literature is the void of empirical evidence on NN impacts. There is a working paper from Nurski (2012) focusing on the United Kingdom and not directly relevant here. There is also a contestation of the FCC’s claimed economic benefits as a result of NN implementation by Hazlett and Wright (2016), though it is not exclusively concerned with infrastructure investment in its analysis. There are also anecdotal analyses from researchers, such as Singer, who claim that NN led to a reduction in ISP network infrastructure investment. However, Singer’s analysis relies on simple year-on-year 6-month period comparisons and only for a small set of companies; there is no incorporation of trends over time, statistical significance, or context (all things this paper directly addresses). Most recently, George Ford (2017) produced a difference-in-difference estimation of NN impacts on telecom investment, the Free State Foundation has a blog post looking broadband capital investment, and a paper from Faulhaber, Singer and Urschel (2017) laments the ‘lack’ of economic analysis at the FCC in the context of the NN debate. The former paper (Ford, 2017) includes no control terms for the numerous confounding factors that exist (e.g. interest rates) and approaches the experiment with a theoretically incoherent counterfactual strategy that uses inappropriate control groups such as “Plastic and Rubber Products Manufacturing” to gain insight on telecommunications infrastructure investment. He also includes no consideration of any other regulations, incentives, or business cycles that may be affecting his selected treatment group and controls. Finally, the author utilizes only 2010 as a treatment year; this is an issue because it provides an incomplete picture. At a minimum, it ignores the Title II 2015 ruling, which should also be tested in addition to the 2010 treatment date, and more broadly ignoring the fact that the author’s organization itself claims the 2015 Title II ruling was unexpected and caused a sudden shift in practice for ISPs (United States Telecom Association et al. v. Federal Communications Commission and United States of America, 2015). The Free State Foundation post is a chart with no author, no data sources, no statistical analysis. It also only uses data from 13 companies and not industrywide information. On the other side, the group Free Press analyzed the impacts of NN in 20166 and found no negative impact on network infrastructure investment since the 2015 NN ruling. On the contrary, the analysis showed that network investment, revenues and profits, subscriptions all continued their growth after the 2015 Title II ruling. Furthermore, the authors provide an updated report from 20177 using SEC filings showed that ISP capital expenditures among publicly-traded ISPs were, in fact, up by 5.3 % in the two-year period following the ruling compared to the two-year period preceding the ruling. These findings provide evidence repudiating the speculated negative harms. And the report from Faulhaber et al. critiques the underlying economic rationale of the FCC in its 2015 NN decision; though, they (their report) have been critiqued by Winseck and Pooley (2017) for biased analysis. More directly to the debate on causality itself, the FCC (2017) conducted a review of studies and data on telecom infrastructure investment and found the claims of decreased investment as a result of NN to be unsubstantiated – both theoretically and in the data.8 There are also a number of articles from slightly different perspectives – those less concerned with economic analyses of infrastructure investment.9 Brennan (2017) examines the NN debate in the run up to the 2015 Open Internet Order and argues that non-economic issues and concerns should have been given more weight prior to the 2015 implementation. In particular, the author gives stronger emphasis on the legal arguments in the NN debate. Connolly, Lee, and Tan (2017) examine NN in the context of the urban-rural digital (broadband access) divide. However, the authors only examine the theoretical appropriateness of existing economic models and their components without proposing their own model on the impacts of NN on the rural-urban digital divide. Crandall (2017) turns to stock market reactions to the 2015 NN rules and found negative impacts on equity in just three companies with those impacts being short-lived. The author also found no impacts on media companies, the intended beneficiaries as he argues. In short, the foundation of critical arguments has been and continues to be based on theoretical hypotheses and speculation not supported by robust analysis.10 And while theory is important, empirical investigation is required to determine its validity in an applied policy context. The time is right to ground the net neutrality debate in empiricism and not merely economic theory and speculation – in other words, they present no empirical evidence.
The Impacts Of Net Neutrality In The United States
The general approach of the paper relates to the state of NN regulation in the United States over the past seven years, under which ISPs and edge services have operated under a NN environment. The two dates and actions of note are the FCC Open Internet Orders of 2010 and 2015. These actions created and reinforced a ‘NN environment’ and provide the paper two trigger points for analyzing potential impacts. The paper utilizes a set of descriptive analyses and econometric tests to investigate issues one at a time. The paper describes the specific methods, data, and results in the following subsections. While the empirical exercises that follow here investigate the critiques and theorized harms of NN rules,11 it is important to emphasize that the paper does not investigate the theorized benefits of NN. This report finds similar and corroborating evidence of previous analysis – a clear lack of speculated harms and initial evidence of benefits to markets, consumers, and innovation with both ISPs and edge providers thriving under NN rules. However, the paper does not claim to find a positive causal relationship between the lack of a slowdown in telecom infrastructure investment and the FCC policies – it merely aims to demonstrate the lack of causal impact in either direction.
3.1 Net neutrality and investment (dis)incentives
3.1.1 Investment trends over time
The most significant issue raised in NN critiques is the potential impact the policy would have on telecommunications broadband infrastructure investment. The literature show that there are three specific areas of potential concern: 1) the creation of a disincentive to invest in telecommunications and related infrastructure (see Pil Choi and Kim, 2010; Cheng et al., 2011); 2) a resulting bottlenecking of networks where ISP capacity is overwhelmed (see Baumol et al., 2007; Hahn et al., 2007); and 3) a related reduction in the quality of service as a result of capacity issues and the lack of investment (see Litan and Singer, 2007). The logic of this line of argumentation comes from theory – if ISPs were unable to extract higher fees, there would be little incentive for them to improve the quality of their offering. Simply, infrastructure investment in telecom infrastructure (by telecom companies or other stakeholders) would decline relative to ‘what would have been’ (i.e. a counterfactual) as a result of NN if these theories were correct. Leaving aside analysis of the logic itself,12 the paper examines this claim by examining how investment levels in the United States changed following implementation of NN through a variety of analyses. To begin, the paper conducts analysis of several indicators for telecom network investment in the United States. First, it analyzes telecommunications infrastructure investment in the US and other OECD countries.13 Second, it analyzes data on cable and broadband infrastructure investment in the US. Third, it analyzes broadband provider capital expenditures in the US. Fourth, it examines total inland infrastructure investment in the US and other OECD countries. Fifth, it examines total infrastructure investment in the US and other OECD countries. Finally, the paper then looks at corollary metrics for investment including 1) broadband speeds, 2) broadband customers, 3) broadband subscriptions, 4) broadband penetration rates, 5) fiber network subscriptions, and 6) employment specifically in telecommunications infrastructure installation professions. Using these metrics the paper conducts a variety econometric tests including difference-in-difference testing using multiple counterfactuals (both observed and synthetic), interrupted time-series regressions, built-in statistical package causal impact estimations, and descriptive analyses. In all the econometric work, the paper includes a variety of control terms. Additionally, the paper runs all analyses for both 2010 and 2015 treatment years. The OECD comparator is utilized as the primary counterfactual in differencing for two primary reasons. First, the trade association USTelecom utilizes these two groups – the U.S. and the OECD – as comparators in a variety of analyses and so this paper preserves analytical consistency while also being able to draw on the same data used by the telecom industry, which preserves consistency in the discussion as well. Second, the paper argues that OECD countries offer a preferable counterfactual(s) to other approaches, such as using alternate industry investment figures, since it allows direct comparison of telecom investment directly.14 The paper utilizes the OECD counterfactual in multiple approaches. It should clearly be noted that there are no data specifically on telecommunications infrastructure investment past 2015 for multiple countries or groups that allows comparison or robust statistical analysis. The result is that any analysis must use either 1) forecast data, 2) biased samples (i.e. not industry-wide figures), 3) non-telecom related comparators15, or 4) 2010 as their only treatment year. These limitations only heighten the importance of conducting multiple analyses with multiple methods and indicators. Unlike other previous analyses without counterfactuals or that have used inappropriate counterfactuals that are dissimilar and incomparable, this paper’s approaches allow for multiple direct ‘apples-to-apples’ comparisons between treatment group and control as well as a clearer treatment action. Table 1 provides the details of the metrics, years of observation, and data sources (in parentheses) while Figures 1-2 and A1 provide visualizations of telecommunications infrastructure investment (as measured by USTelecom and the OECD), cable and broadband infrastructure investment, and total infrastructure investment respectively. Figures for the United States are shown in blue while the counterfactual, OECD countries minus the U.S., are shown in red. Figure 3 provides a visualization of the synthetic counterfactual.
Table 1: Infrastructure Investment Data
| Metric | Years | Source | Countries/Groups |
|---|---|---|---|
| Telecommunications infrastructure investment per capita | 1996-2013 2014-2020 forecast16 1995-2014 | USTelecom and OECD* AR(2) technique; based on USTelecom data and PricewaterhouseCoopers and Oxford Economics forecasts Synthetic control uses a variety of data from World Bank | USA OECD* *Analysis run using figures both aggregated and disaggregated across OECD countries |
| Cable infrastructure investment | 1996-2016 | SNL Kagan | USA |
| Broadband infrastructure investment | 1996-2015 | USTelecom | USA |
| Total infrastructure investment | 1996-2014 2006-2020 | OECD (1996-2014) PricewaterhouseCoopers and Oxford Economics (2006-2020) | USA OECDUSA |
*Organization for Economic Cooperation and Development
Figure 1: Telecommunications Infrastructure Investment Per Capita  Note: forecasts shown with gray lines; calculated using AR(2) technique Figure 2: Cable and Broadband Infrastructure Investment
 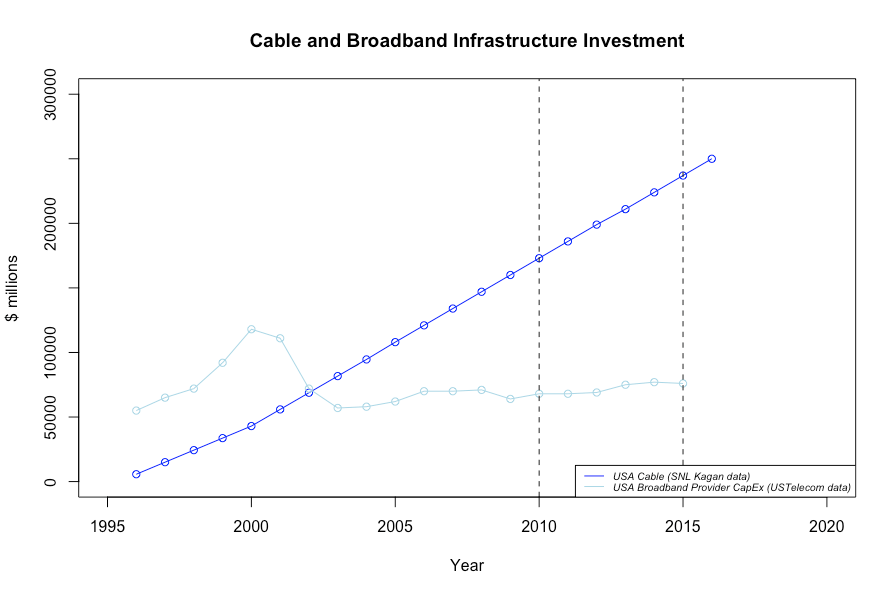 Figure 3: The (Non) Impact Of Net Neutrality On Telecom Infrastructure Investment
3.1.2 Measuring impact and cross-checks
The plots show infrastructure investment levels over approximately two decades and reveal no obvious impact from either the 2010 or the 2015 Open Internet Orders. Infrastructure investment levels either remain steady or increase consistently from the mid-1990s to today and are forecasted to continue in the same manner through 2020 as supply increases to seek to match demand for internet access.17 This is the case for telecommunications infrastructure, broadband provider capital expenditures, cable and broadband infrastructure investment, total inland infrastructure investment, and total infrastructure investment. There is a decline in infrastructure investment across types for the United States in the early 2000s (approximately 2001-2003), but the drop ceases before 2005 and has no relevance to NN impacts since it is well before the first action date of 2010.18 The report begins its econometric analysis with difference-in-difference estimators (for both 2010 and 2015) utilizing data for U.S. and the OECD. Three counterfactuals were used: 1) telecom infrastructure investment volumes per capita – US aggregate versus OECD aggregate (minus the US) from 1996 to 2013 with forecast extensions to 2020; 2) total inland infrastructure investment – disaggregated for every OECD country – for 1995-2014; and 3) total inland investment – using a synthetic control constructed by first removing all countries that have NN or have discussed it in their legislative bodies and then developing weighted averages based on individual country similarities to the United States. A vector of control variables including growth, total infrastructure investment, and average annual interest rates along with time fixed-effects (year) and country fixed effects (where relevant) are included. The applied model is defined as: ![]() Where Y is infrastructure investment levels in country i at time t. The term is a dummy indicator for the treatment group (the U.S.), is a set of time fixed-effects, is the treatment interaction for each observation in the treatment group after the policy implementation, is the set of controls and epsilon is the error term. The report calculates and reports both unadjusted standard errors and robust standard errors using the Arellano-Bond bond method to adjust for heteroscedasticity and serial correlation, along with the “HC3” estimation type under the plm package in R (Yves Croissant, 2008) to account for the small sample size. The report also re-estimated impact using a 1-year lag of telecom infrastructure investment to account for any potential delay in infrastructure investment level changes as a result of the action dates. Next, the report conducts two analyses on 1) U.S. cable and broadband investment and 2) U.S. Broadband Capital Expenditures. These tests utilize 2015 as their treatment year, since both datasets have observed figures for 2015 and 2016. The report utilizes a regression discontinuity design without the OECD counterfactual due to lack of data for the OECD for cable and broadband infrastructure investment.19 Finally, the report runs a third set of analyses using the CausalImpact R package (Brodersen et al., 2015) designed to pick up the causal impact of interventions (and their statistical significance) on time series data using a Bayesian structural time-series approach. The paper conducts analysis for both 2010 and 2015 treatment years and using both the embedded model (based a pre-post temporal counterfactual using the OECD aggregate counterfactual) and the full OLS model specification in the difference-in-difference estimator. To illustrate the closeness of fit (and singularity issues arising from it), the paper adds an auto-regressive term to its final model-based estimation in the CausalImpact package robustness exercise.
Where Y is infrastructure investment levels in country i at time t. The term is a dummy indicator for the treatment group (the U.S.), is a set of time fixed-effects, is the treatment interaction for each observation in the treatment group after the policy implementation, is the set of controls and epsilon is the error term. The report calculates and reports both unadjusted standard errors and robust standard errors using the Arellano-Bond bond method to adjust for heteroscedasticity and serial correlation, along with the “HC3” estimation type under the plm package in R (Yves Croissant, 2008) to account for the small sample size. The report also re-estimated impact using a 1-year lag of telecom infrastructure investment to account for any potential delay in infrastructure investment level changes as a result of the action dates. Next, the report conducts two analyses on 1) U.S. cable and broadband investment and 2) U.S. Broadband Capital Expenditures. These tests utilize 2015 as their treatment year, since both datasets have observed figures for 2015 and 2016. The report utilizes a regression discontinuity design without the OECD counterfactual due to lack of data for the OECD for cable and broadband infrastructure investment.19 Finally, the report runs a third set of analyses using the CausalImpact R package (Brodersen et al., 2015) designed to pick up the causal impact of interventions (and their statistical significance) on time series data using a Bayesian structural time-series approach. The paper conducts analysis for both 2010 and 2015 treatment years and using both the embedded model (based a pre-post temporal counterfactual using the OECD aggregate counterfactual) and the full OLS model specification in the difference-in-difference estimator. To illustrate the closeness of fit (and singularity issues arising from it), the paper adds an auto-regressive term to its final model-based estimation in the CausalImpact package robustness exercise.
3.1.3 Results
The econometric results are given in Appendix B – Tables B1-B5. The CausalImpact analysis is provided in Appendix C. Across all tests and specifications, the results indicate no (negative) impact from either the 2010 or 2015 NN actions – the direct causal effects of the NN rulings are statistically indistinguishable from zero. The analysis results reveal a few things. First, they confirm the initial inspection. Second, they demonstrate that the theorized and speculative negative harms of NN on infrastructure and investment incentives predicted before the FCC took action did not, in fact, happen when we examine the data. And third, they illustrate the difficulty in claiming, with any substantiation, direct causal effects from a single policy decision on an entire class of infrastructure investment – both from the amount of potential confounding factors and from data issues such as sample bias. Indeed, this paper makes no such causal impact claims regarding NN despite the fact that the regression coefficients of interest were positive in all but one case. Rather, its analysis demonstrates that when properly considered from a variety of angles, there is no evidence of NN impact – one way or another. The key takeaways from the analysis are that there is no evidence of a decrease in investment in the US and, while we cannot establish a causal link because of the complexity of accounting for other factors,20 there is clear evidence of continued telecom investment after NN implementation. This may lead to questions of ‘why’, but if we return to the literature, there are clear, longstanding explanations. Despite claims that NN rules would reduce incentives to invest in telecom and related infrastructures, game theory and other models had already illustrated this to be unlikely. Cheng et al. (2011) demonstrated that NN rules would lead to an investment equilibrium at the socially optimal level, while an absence of NN rules would lead to either over- or under-investment by ISPs.21 The 2010 piece from Pil Choi and Kim argued that capacity expansion (under NN rules), would still be incentivized by the ability to extract higher access fees due to the uniform nature of content delivery speed improvements.22 They argue that, despite claims of disincentives arising from NN rules, they could not rule out higher incentives to expand capacity and infrastructure investment as a result of NN rules. Furthermore, when we combine these theoretical observations with the empirical data analysis and with the fact that arguments on negative impacts from NN on infrastructure investment are over a decade old (e.g. Baumol et al., 2007; and Hahn et al., 2007; Litan and Singer, 2007), we see the initial speculation around NN was unfounded. Both in terms of immediate impacts (those occurring one to two years after NN implementation) and longer-term impacts (those occurring over three years after NN implementation), there is no evidence to suggest that NN implementation has led to any negative impacts on (broadband) infrastructure investment.
Corollary Metrics
As the paper has noted, it is difficult to prove causality and the data for telecommunications infrastructure investment are imperfect – hence its strident call for comprehensive analysis. In this vein, the paper now turns to indirect indicators of telecommunications infrastructure investment to examine if they corroborate the econometric work.
4.1 Capacity And Mediocrity
A related concern to infrastructure investment incentives (and NN’s impact on them) is the capacity of ISP networks. The theory is that with less incentive to invest in telecommunications infrastructure (as a result of NN rules), existing telecom networks would not be updated and would become overburdened by too much traffic and use. In such a case, service would languish in ‘mediocrity’ due to an inability to alleviate bottlenecks and accommodate customers. (Litan and Singer, 2007) Assuming that firms are driven by profit, that quality of service is important for earning profits, and that NN affects the ability to deliver high-quality, a firm is left with two choices in a NN environment: 1) they could stop investment in network infrastructure and quality would suffer, or 2) they could continue network investment, which would result in either lower revenues or higher prices for consumers. Put more plainly, negative impacts from NN on would lead to either a reduction of infrastructure investment, a reduction of quality, or either a decrease in revenue (which would have to be absorbed or covered by increased prices in order to maintain profitability).23 The paper has already shown that telecommunications infrastructure investment has increased or remained steady in the years between 2010 and 2015 and that there is no evidence of any impact from either the 2010 or 2015 NN ‘actions’. Furthermore, forecasts for future investment are neutral to positive. Broadband access providers continue to operate and continue to upgrade their network capacity.
4.2 Quality Of Service
The paper has shown there is no statistical evidence of NN impacts on infrastructure investment. To confirm this story, the paper now turns to network coverage and quality metrics for corroboration. Service quality can be measured by two primary indicators – speed and accessibility. Thankfully data for both areas are publicly available and comprehensive. The paper sourced information from the OECD and from the National Communications and Television Association and (NCTA). As of June 2016, there were 104.6 million fixed broadband subscriptions in the United States. This is nearly three times (2.74) as many as the second largest OECD broadband subscription market, Japan. There were 393.4 million wireless broadband subscriptions in the US – the second largest was again Japan with 185.7 million wireless broadband subscriptions.24 Starting with coverage growth (an important indirect indicator of network investment), year over year, from June 2015 to June 2016, fixed broadband penetration in the US increased by 3.55 percent and wireless broadband penetration grew by 10.0 percent. Furthermore, fiber subscriptions grew by 16.05 percent and was also greater than the OECD average.25 Annual growth is shown for fixed broadband and wireless broadband in Figures 4 and 5 respectively. Using a slightly different metric from NCTA, the volume of cable broadband customers has increased every year from 2005 to 2015 with approximately 58 million customers in 2015 (NCTA, 2017).26 And turning to yet another potential metric, employment in positions for telecommunications infrastructure installation and maintenance showed an increase of approximately 0.9% from 2015 to 2016 (Bureau of Labor Statistics, 2017b).27 This is shown in Figure 6. Finally, and perhaps most impressively, according to telecom company-reported data (via NCTA), top cable broadband speeds have doubled between 2014 to 2016 and has increased by 125 times over speeds in 2007 – from 16 mbps to 2 gbps – with increases every year over that period. This is shown in Figure 7. Together these figures clearly show continuous improvement of service both in terms of network coverage and quality of service over time. Net neutrality had no impact on infrastructure investment – this is confirmed by the fact that there has been no impact on service quality. Figure 4: Fixed Broadband Penetration Growth  Source: OECD (2017) Figure 5: Wireless Broadband Penetration Growth
 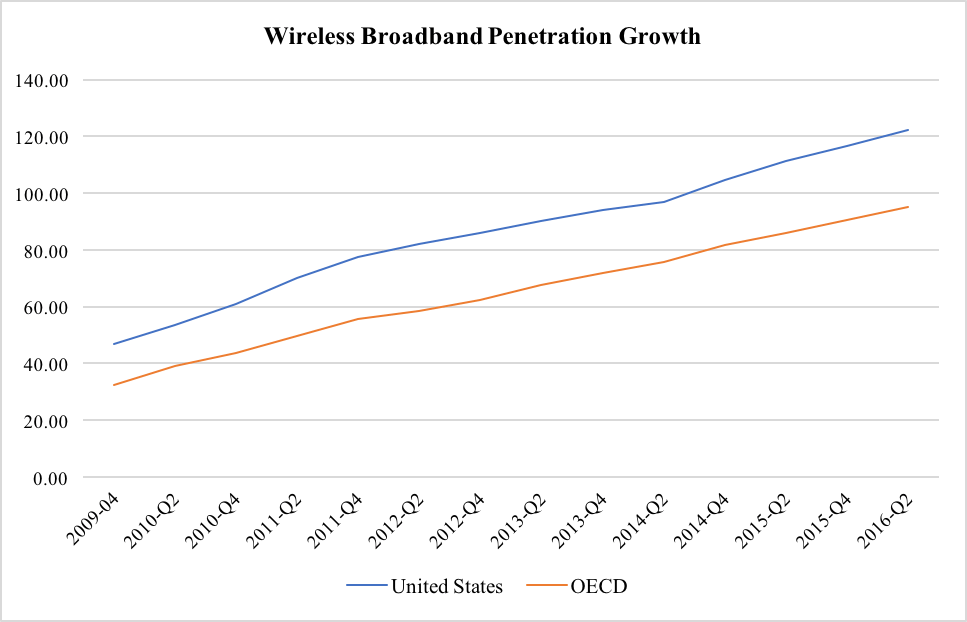 Source: OECD (2017) Figure 6: Telecommunications Infrastructure Employment
 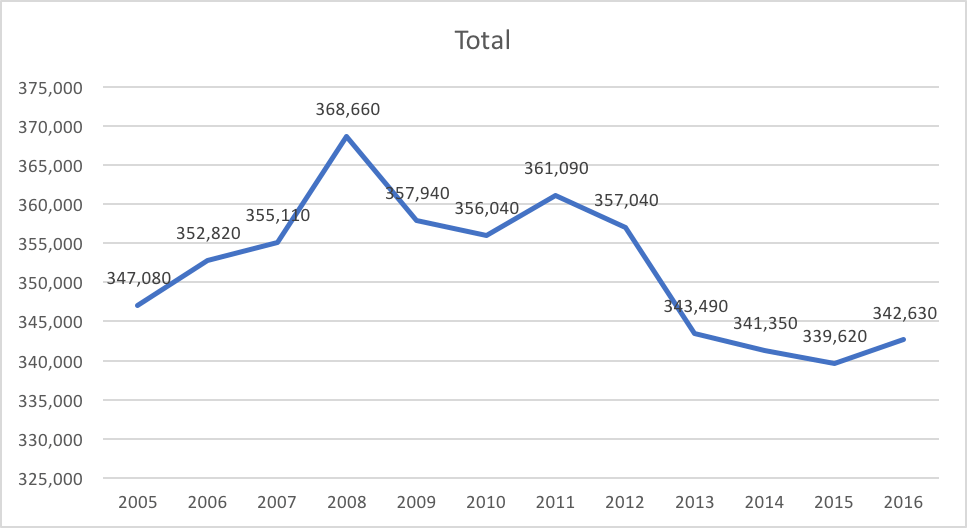 Source: Bureau of Labor Statistics (2017) Figure 7: Top Cable Speeds (GBPS)
  Source: NCTA (2017)
4.2.2 Prices
With continued infrastructure investment clearly shown – by both a variety of investment indicators and quality of service indicators – the final element to consider is if and how prices have reacted to NN. To quickly recap, theorized negative harms from NN would materialize either in decreased investment and decreased quality of service, or increased prices (in reaction to lower revenues). Consequently, we are left with the second scenario and with the following secondary questions:
- Have prices increased to help cover the sustained infrastructure investment; or,
- Has industry revenue fallen?
Utilizing Bureau of Labor Statistics (2017a) data for 1995-2016, the paper compiled Producer Price Index (PPI) figures for the telecom sector – both wireless carriers and wired carriers. The paper also compiled figures for the total number of internet users (World Bank, 2017) and data production volume (Computer Science Corporation, 2016) as proxies for network usage. The paper converted these metrics into standard deviation units (z-score units) to allow for comparison of trends for prices and usage over time. The paper plots these figures in Figure 8 and provides pairwise correlation estimates in Table 2. The PPI figures allow for direct analysis of telecom sector prices (including ISP prices) over time. According NN critics, since infrastructure investment has continued, the supposed negative harm may have been transferred to prices. The paper also examines the PPI trends with the network usage trends as a secondary check on NN impacts – since the theorized decrease in infrastructure investment would lead to capacity issues, the paper would expect a strong correlation between increased network usage and price increases. Figure 8: Telecommunications Producer Price Indexes 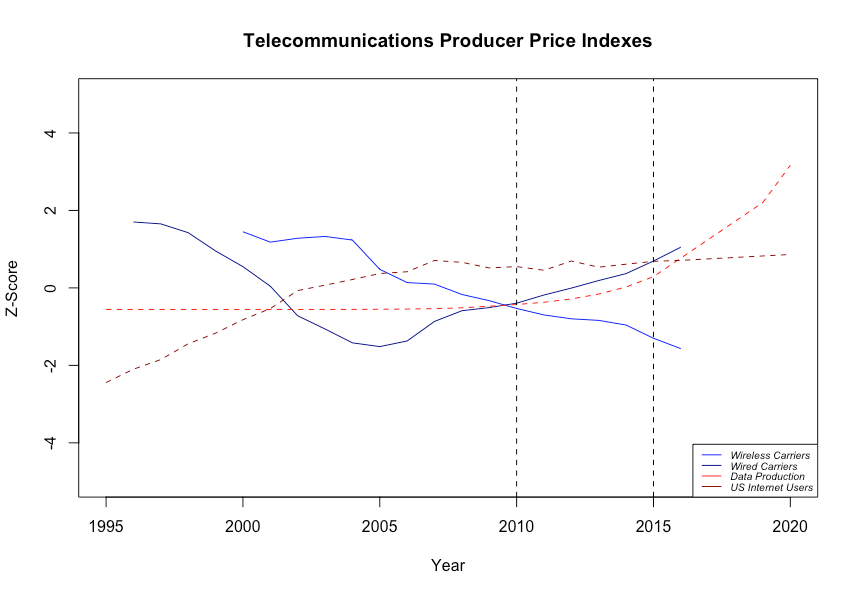
Table 2: Correlation Of Telecom PPI And Network Usage
| Variable Pair | Covariance | p-value |
|---|---|---|
| Wired Carriers – Data Production | 0.3005 | 0.1856 |
| Wireless Carriers – Data Production | -0.7581 | 0.0004 |
| Wired Carriers – Internet Users | -0.6490 | 0.0015 |
| Wireless Carriers – Internet Users | -0.8014 | 0.0001 |
Note: Wireless carrier PPI coefficients use observations from 2000-2016; Wired carrier PPI coefficients use observations from 1996-2016 Note: H0: True correlation is equal to 0; H1: True correlation is not equal to 0
There are a few things to note in Figure 8. First, PPI levels for the telecom industry – both wireless carriers and wired carriers – are below levels for their first available year of observation – wired carrier PPI in 2016 is below what is was in 1996 and wireless carrier PPI is below what it was in 2000. The telecom sector is enjoying relatively lower producer prices. Second, wireless PPI has dropped consistently since 2000 while wired PPI levels have fluctuated with a decline from 1996 to approximately 2005 and a steady climb since then. In other words, the NN actions of 2010 and 2015 have had no effect on the trajectory of either wired or wireless producer prices – corroborating the earlier analysis which found no impacts from NN on infrastructure investment. Third, usage metrics show no clear correlation with wireless PPI and no clear correlation for 1996-2007 for wired PPI, while post-2007 wired PPI does increase in a similar fashion to data production. This suggests that the claimed negative impacts of NN were not transferred to prices to accommodate increased network usage (and continued infrastructure investment), especially since 2016 PPI levels are below those seen 20 years earlier. When we examine the Pearson correlation coefficients in Table 2, we see negative correlations between wireless PPI and data production, wireless PPI and internet users, and wired PPI and internet users. Far from increased usage and ‘regulatory burden’ driving costs, the indicators move in opposite directions. In all cases, these figures are statistically significant, though the paper cautions the important takeaway is the negative coefficients and not their significance levels given the small number of observations. The only pairwise coefficient that is positive comes from the relationship of wired carrier PPI and data production. However, the correlation coefficient is weak, at just 0.3005 and does not signal significance. These results demonstrate that the telecom sector is not transferring negative NN impacts to prices nor experiencing capacity issues. Together, they demonstrate the theorized policy justification for abolishing NN (see Yoo, 2006) based on capacity strain and bottlenecking of networks have not materialized over the past seven years of NN implementation – there is no evidence of such speculative harms.
4.2.3 Revenues and equity
When we turn to the other side of the story – revenues and value – we find a corroborating picture yet again. Using data on currently operating, publicly listed telecommunications companies and internet service providers obtained through www.investsnips.com (last updated on December 22, 2016 with analysis conducted in March 2017), the paper examined trends in net revenue and firm equity in the sector. The site provided stock codes for public companies and the paper used these codes to collect annual corporate earnings (total net income) from www.advfn.com for years 2006 through 2016.28 Additionally, the paper also collected data on corporate equity (from www.advfn.com), which accounts for the value of all assets and all liabilities (and not just net income) as a proxy for overall company value. Given the approach to the data collection, there are two things that should be noted. First, all of the data collected were based on the set of companies operating as of December 22, 2016.29 While this list is presumably exhaustive of all public telecommunications companies by the end of 2016, it is not exhaustive of all companies that operated over all periods between 2006-2016. It is possible that companies ceased operating under a particular stock code for various reasons (e.g., name change, merger, acquisition, closure) and that they were excluded from this particular examination in years prior to 2016. As such, the extent to which the data collected for earlier years deviates from full representation of the industry is unknown. This also inevitably leads to an increase in missing values during the earlier years as compared to the more recent years. However, we also note there are no clear indications skewing in years prior to 2016. Second, the number of corporate earnings reported in 2016 were generally low due to variations in company fiscal year dates. Since the majority of the companies that have already released their financials are among the largest companies in the industry, the resulting aggregated values are clearly biased for the year 2016. More specifically, the 2016 figures are skewed upward for mean and median figures while the sum figure is skewed downward. Finally, the paper also initially looked at using daily adjusted closing stock prices were collected from Yahoo Financials (finance.yahoo.com) for each company. However, an initial examination of the distribution resulting from the aggregated data revealed large variation between years. This was due to the fact that adjusted stock prices were scaled by the closing price of the end date of the range of interest (i.e., January 1, 2017). In effect, the adjusted closing stock price for a particular company could shift between arbitrarily low or large values based on whatever scaling constant was used. Consequently, the paper chose to leave out this particular metric.30 Figures 9 and 10 provide graphs of the mean, median, and aggregate net income and equity value of the telecom industry. Additionally, the paper provides a set of graphs plotting mean figures for net income, equity, and merger/acquisition against the number of mergers and acquisitions. Given the limitations in the data collection process, the paper does not perform any statistical tests on these data and argues that the key insight they provide is their representativeness in overall sector trends over time. Figure 9: Telecom Industry Equity Over Time 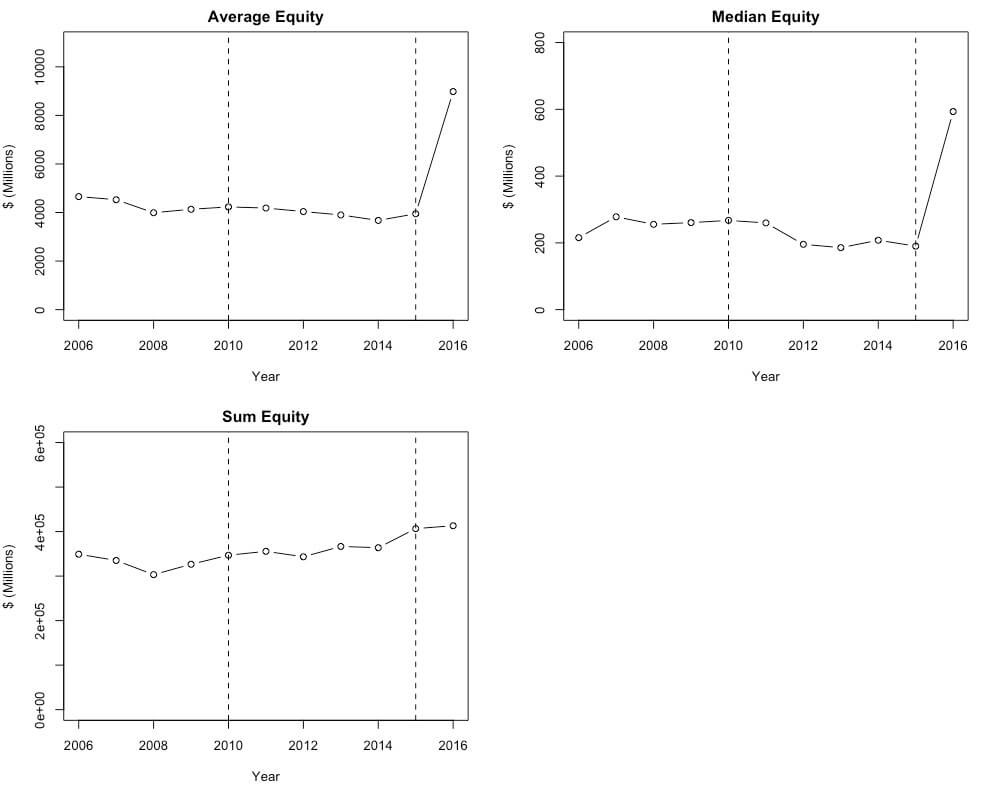 Note: Due to differences in fiscal years and reporting dates, figures for 2016 are skewed upward for average and median graphs and downward for sum graph. Figure 10: Telecom Industry Net Income Over Time
 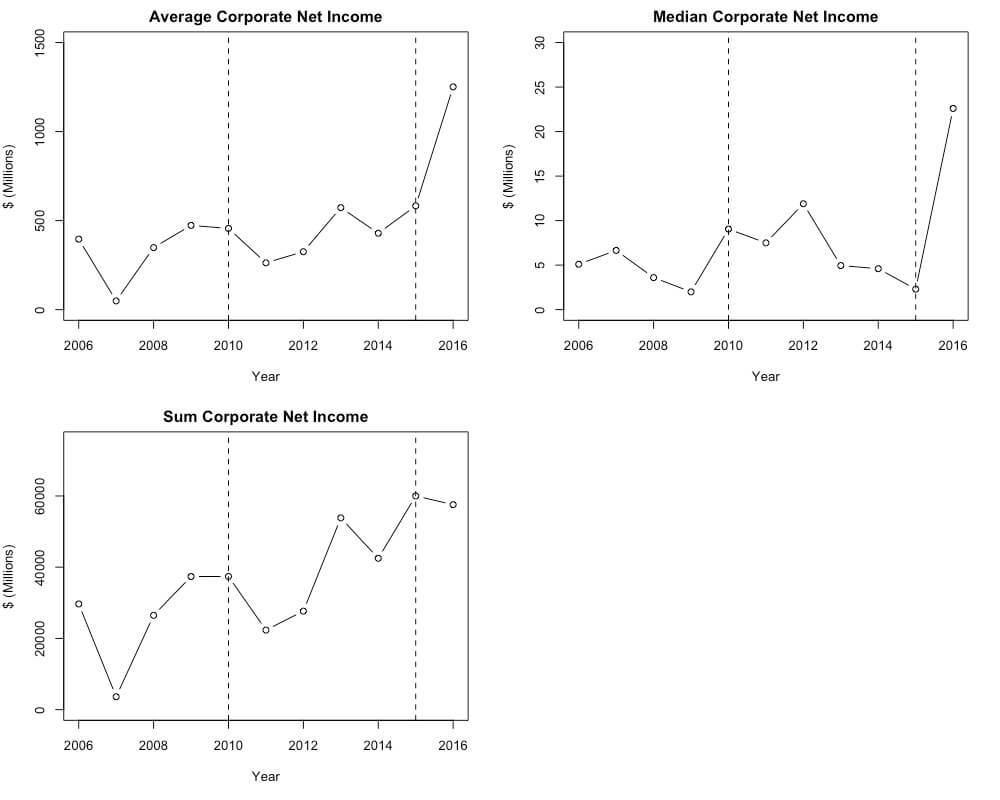 Note: Due to differences in fiscal years and reporting dates, figures for 2016 are skewed upward for average and median graphs and downward for sum graph. The plots in Figures 9 and 10 show steady rises in overall corporate net income and equity for the telecom sector since 2008. Put more simply, industry revenue and value have grown over the past nine to ten years. This is despite a steady increase in infrastructure investment over that period and perhaps reflective of the low producer price index levels for the sector shown in the previous sections. Together, we see evidence of a strong sector with sustained infrastructure investment, low costs, and increasing revenues and equity. This is a far cry from the harms speculated prior to NN implementation. Furthermore, these figures corroborate the findings of Crandall (2017), which found essentially no impact (good or bad) from NN on markets. Once again, these figures reinforce the overarching reality that the 2010 and 2015 NN orders have had no negative impact on the telecommunications industry.
4.2.4 Alternative approaches to innovation impacts
Finally, there is the less-discussed, though nonetheless contentious and related, issue of the impact of NN on innovation from BIAS providers. Supporters of NN argue strong benefits for innovation by allowing start-ups to experiment and develop and by preventing incumbent players from pushing out competition by simply foreclosing this upstart competition. In a non-NN environment, one which allows discriminatory prices, the theory is that firms with less capital, such as start-ups, small, and medium-sized enterprises, would be vertically foreclosed by BIAS providers seeking to favor their affiliated content – the result being less incentive to establish start-ups and less experimentation that leads to innovation. Critics, on the other hand, argue that NN rules are a form of favoritism that simply shift innovation from within network (i.e. by ISPs) to edge service firms. (Cerf, 2006; Sidak, 2006; Pil Choi and Kim, 2010) This argument is often lumped into the infrastructure investment component and, consequently, measured via infrastructure investment indicators (in a clunky manner). However, given we have NN implementation dates (as opposed to removal dates), the paper examines the latter arguments from NN critics using an alternative approach/metric. Using a standard approach to measuring knowledge and innovation based on the work of Jaffe, Henders, and Trajtenberg (see the key works from Jaffe et al., 1993 and Trajtenberg, 2009), the paper looks at industry innovation through the lens of patents. The data comes from the United States Patent and Trademark Office (USPTO) and is compiled by the number of patent applications per year and the number of patent expirations per year across the economy31. The paper uses the “Telecommunications” (USPCS code 455) designation for patents related to ISPs and a series of classes for patents related to the internet sector based on input from IA member firms to serve as a proxy for edge services. It should be noted that the paper does not claim these set of patent classes or patent classes in sum to be a perfect proxy for capturing innovation by ISPs or edge service firms; however, it does argue they serve as another metric that can help shed light on the impact of NN on telecom investment and innovation. The important note to once again emphasize is that no single metric or data point proves or disproves anything – the whole context must be considered. For both data sets, the paper collects observations for the full record available from the USPTO using its “historical master file”. Additionally, the paper collects data on the volume of Triadic ICT patents (using OECD data).32 Both metrics are plotted in Figures 11. Both metrics are shown with solid lines while trend lines are shown with dashed lines. Figure 11: Trends In Patents Over Time  In patent applications for the telecom industry and edge service providers, there are clear and steady upward trends from approximately 1990 onward. In neither case, does the 2010 Open Internet Ruling show any clear impact on the variations or trends.33 There are no data after 2014. Using the alternate metric of triadic patent families, there are slow declines for every year of observation since 2006 – again revealing no indication of an impact effect from the 2010 ruling. Furthermore, there is no indication of a ‘shifting’ effect from within network to without network innovation.
Consumers And Net Neutrality
The evidence provided in Sections 3 and 4 speaks to a larger issue in the debate on net neutrality: transparency. The arguments against NN rules relies on theory and models – providing it an air of formality, but without evidence to support it. This paper has demonstrated the opaqueness of critics’ arguments when examined in the light of empirical evidence, but there remain questions around the impacts that could arise from removing NN. The primary concern34 as discussed by Wu (2006a), is the lack of transparency for consumers that would arise in a non-NN environment. It has already been noted that ISP payment structures without NN would result in a highly-concentrated edge provider market, dominated by only a few internet firms (Vint Cerf in Waldmeier, 2006). The internet industry itself (including those firms that would stand to gain) fully recognizes this and actively supports NN rules to prevent that consolidation and domination from happening. The internet sector understands that any potential gains in the short-term, for which there is no clear evidence, would be far outweighed by the medium to long-term harms from the lack of competition, the resulting monopolistic market structure, and direct impacts to individuals and firms that rely on NN to develop. It has also been recognized that ISPs would gain from the removal of NN rules by allowing them to extract expensive access fees from both edge services and consumers (Cheng et al., 2011). With no evidence of investment disincentives, capacity pressures, cost pressures, reduced revenues or value, or reduced innovation, there is scant empirical basis for removing NN rules. Furthermore, even critical perspectives recognize the value of NN rules, particularly for consumers. Vogelsang (2013), for example, notes the numerous benefits that arise from NN rules including transparency requirements, quality standards, and spectrum management. While some self-proclaimed neutral researchers have cautioned against simplistic arguments either for or against NN rules, it is argued by some that social welfare is maximized when all consumers can directly access all content providers and that this is achievable given the underlying, open structure of the internet – at least with NN rules in place. (Cheng et al., 2011; Greenstein et al., 2016) Thus, we arrive at the crux of the issue – what value critics use to argue for the removal of NN. Some have framed it as an issue of balancing efficiency versus fairness (Odlyzko, 2009). However, the paper attests based on the evidence presented here and elsewhere that the conflict is better described as perceived efficiency versus fairness. Current NN rules have led to none of the efficiency losses theorized by ISPs and NN critics; the markets have remained strong even while the internet sector, the technology sector, edge services, and ISPs have all thrived. The telecom industry is enjoying innovation, increasing revenues and equity values, and increased investment – even while operating under NN rules. As demonstrated through empirical analysis, a NN system does not represent an ‘either or’ proposition. Once we follow the evidence and remove that perceived reduction in efficiency (as the evidence clearly shows us we should), what arguments remain other than simply boosting revenue and profits even further at the expense of market competition and consumer choice and fairness?
Conclusion
Net neutrality is important. The policy is the foundation to fair market competition for ISPs, internet firms, and related industries. It is a critical system for ensuring small businesses and their employees can compete in the 21st century economy and it is vital for ensuring fair and open internet access. No other sector has contributed as much to job growth in the United States in recent years than the internet sector and NN has provided the foundation for those millions of jobs to develop. This debate is not simply about ideological differences, it is about protecting American workers and businesses by ensuring fair competition through NN. The empirical evidence shows that the implementation of NN rules has had none of the negative impacts theorized by its critics a decade ago. Far from a great strain on infrastructure investment, network capacity, and innovative activity, NN rules have had no negative effect on the telecommunications sector in these areas. The sector has thrived while edge services have opened an entirely new economy bringing millions of new jobs and hundreds of thousands of new businesses to our economy. Net neutrality has been crucial for that development. It is important and welcome to debate the theorized merits and flaws of policies prior to their implementation – this is a healthy exercise that helps guide policymaking. However, it is even more critical to examine policies once they are in place and use empirical evidence to guide any proposed changes to them. This paper has done precisely this, showing there is no evidence to support the removal of NN rules and ample reasons to maintain them. Rather than relying on old speculation, we must acknowledge the actual evidence.
References
- Baumol, William J., Martin Cave, Peter Cramton, Robert Hahn, Thomas W. Hazlett, Paul L. Joskow, Alfred E. Kahn, Robert Litan, John Mayo, Patrick A. Messerlin, Bruce M. Owen, Robert S. Pindyck, Scott J. Savage, Vernon L. Smith, Scott Wallsten, Leonard Waverman and Lawrence J. White. 2007. “Economists’ Statement on Network Neutrality Policy.” Related Publication 07-08. AEI-Brookings Joint Center For Regulatory Studies.
- (BLS) Bureau of Labor Statistics, U.S. Department of Labor. 2017a. Producer Price Index Industry Data.
- (BLS) Bureau of Labor Statistics, U.S. Department of Labor. 2017b. Occupational Employment Statistics Survey (2005-2016).
- Brennan, Timothy. 2017. “To Post-Internet Order Broadband Sector: Lessons from the Pre-Open Internet Order Experience.” Review of Industrial Organization. (2017)50: 469.
- “CausalImpact 1.1.3.” Brodersen et al., Annals of Applied Statistics (2015). Online. Accessed February 2017. Available at: http://google.github.io/CausalImpact/”
- Cerf, Vinton G. 2006. Prepared Statement on U.S. Senate Committee on Commerce, Science, and Transportation Hearing on “Network Neutrality”. February 7, 2006.
- Cheng, Kenneth H., Subhajyoti Bandyopadhyay, and Hong Guo. 2011. “The Debate on Net Neutrality: A Policy Perspective.” Information Systems Research. Vol. 22, No. 1, pp. 60-82.
- Choi, Jay Pil and Byung-Cheol Kim. 2010. “Net neutrality and investment incentives.” The RAND Journal of Economics. Vol. 41, No. 3, pp. 446-471.
- Computer Science Corporation. 2016. “The Rapid Growth of Global Data.” Infographic. Online. Accessed February 2017. Available at: http://www.marsd.org/cms/lib7/NJ01000603/Centricity/Domain/202/Big%20Data%20Exploding.pdf
- Connolly, Michelle, Clement Lee, and Renhao Tan. 2017. “The Digital Divide and Other Economic Considerations for Network Neutrality.” Review of Industrial Organization. 2017(5): 537.
- Crandall, Robert W. 2017. “The FCC’s Net Neutrality Decision and Stock Prices.” Review of Industrial Organization. (2017)50: 555.
- Delp, Amanda B. and John W. Mayo. 2017. “The Evolution of ‘Competition’: Lessons for 21st Century Telecommunications Policy.” Review of Industrial Organization. (2017)50: 393.
- Economides, Nicholas and Joacim Tag. 2012. “Network neutrality on the Internet: A two-sided market analysis.” Information Economics and Policy. Vol. 24(2): 91-104.
- Ericson, Brooke. 2010. “‘MÖBIUS-STRIP REASONING’: THE EVOLULTION OF THE FCC’S NET NEUTRALITY NONDISCRIMINATION PRINCIPLE FOR BROADBAND INTERNET SERVICES AND ITS NECESSARY DEMISE.” Administrative Law Review, Vol. 62, No. 4, pp. 1217-1260.
- Farrell, Joseph. 2017. “Some Simple Analytics of Vertically Linked Markets.” Review of Industrial Organization. (2017)50: 431.
- Faulhaber, Gerald R. 2011. “Economics of net neutrality: A review.” Communications & Convergence Review. Vol. 3, No. 1, 53-64.
- Faulhaber, G., Singer, H., & Urschel, A. 2017. “The curious absence of economic analysis at the Federal Communications Commission: An agency in search of a mission.” International Journal of Communication. 11, 1214–1233. Online. Available at: http://ijoc.org/index.php/ijoc/article/view/ 6102/1967
- Federal Communications Commission (FCC). 2017. “Claims That the Open Internet Order Impaired Investment Lack Any Sound Theoretical or Factual Basis.” Online. Accessed April 2017. Available at: https://www.fcc.gov/sites/default/files/true-invest.pdf
- Ford, George S. 2017. “Net Neutrality, Reclassification and Investment: A Counterfactual Analysis. Perspectives. Phoenix Center for Advanced Legal & Economic Public Policy Studies. Phoenix Center Perspectives 17-02.
- Free Press. 2017. Untitled table. Free Press. Online. Accessed February 2017. Available at: https://www.freepress.net/sites/default/files/resources/internet_service_providers_capital_expenditures_2013-2016_reported_as_of_2_27_17.pdf
- Free Press. 2016. “Same As it Ever Was: The U.S. Broadband Market Continues to Thrive One Year After the FCC’s Historic Network Neutrality Vote.” Free Press. Online. Access February 2017. Available at: https://www.freepress.net/sites/default/files/resources/free_press_broadband_market_one_year_later.pdf
- Free State Foundation. 2017. “Investment Impact of Title II Public Utility Regulation.” Blog Post. Online. Accessed April 2017. Available at: http://freestatefoundation.blogspot.com/2017/03/investment-impact-of-title-ii-public.html
- Greenstein, Shane. 2007. “Economic Experiments and Neutrality in Internet Access.” Innovation Policy and the Economy. Vol. 8, pp. 59-109.
- Greenstein, Shane, Martin Peitz and Tommaso Valletti. 2016. “Net Neutrality: A Fast Lane to Understanding the Trade-offs.” The Journal of Economic Perspectives. Vol. 30, No. 2 (Spring 2016), pp. 127-149.
- Haas, Douglas A. 2007. “The Never-Was-Neutral Net and Why Informed End Users Can End the Net Neutrality Debates.” Berkeley Technology Law Journal. Vol. 22, No. 4, pp. 1565-1635.
- Hahn, Robert W., Robert E. Litan, and Hal J. Singer. 2007. “The Economics of ‘Wireless Net Neutrality’”. Related Publication 07-10. AEI-Brookings Joint Center For Regulatory Studies.
- Hammami, Mona, Jean-Francois Ruhashyankiko, and Etienne B. Yehoue. 2006. “Determinants of Public-Private Partnerships in Infrastructure.” IMF Working Paper. WP/06/99. IMF Institute.
- Hazlett, Thomas W. and Joshua D. Wright. 2017. “The Effect of Regulation on Broadband Markets: Evaluating the Empirical Evidence in the FCC’s 2015 ‘Open Internet’ Order.” Review of Industrial Organization. (2017)50:487.
- Hemphill, C. Scott. 2008. “Network Neutrality and the False Promise of Zero-Price Regulation.” Working Paper No. 331. The Center for Law and Economic Studies, Columbia University School of Law.
- Hylton, Keith N. 2017. “Law, Social Welfare, and Net Neutrality.” (2017)50: 417.
- InvestSnips. Online. Accessed February 2017. Available at: http://investsnips.com/
- Jaffe, Adam, Manual Trajtenberg and Rebecca Henderson. 1993. “Geographic Localization of Knowledge Spillovers as Evidenced by Patent Citations.” The Quarterly Journal of Economics. Vol. 108(3): 557-598.
- Katz, Michael L. 2017. “Wither U.S. Net Neutrality Regulation?” Review of Industrial Organization. (2017)50: 441.
- Lee, Robin S. and Tim Wu. (2009). “Subsidizing Creativity through Network Design: Zero-Pricing and Net Neutrality.” The Journal of Economic Perspectives, Vol. 23, No. 3, pp. 61-76.
- Litan, Robert E. and Hal J. Singer. 2007. “Unintended Consequences of Net Neutrality.” (forthcoming) Journal on Telecommunications & High Technology Law.
- Marsden, Christopher T. 2009. “Net Neutrality: Towards a Co-regulatory Solution.” New York: Bloomsbury Academic.
- Mitzutani, Fumitoshi. 2005. “Productivity Effects and Determinants of Public Infrastructure Investment.” Discussion Paper Series. Graduate School of Business Administration, Kobe University.
- (NCTA) The Internet & Television Association. 2017. Industry Data. Online. Available at: https://www.ncta.com/data-stats
- Nurski, Laura. 2012. “Net Neutrality, Foreclosure and the Fast Lane: An empirical study of the UK.” Working Paper #12-13. NET Institute.
- (OECD) Organization for Economic Cooperation and Development. 2017. OECD Data. Paris.
- Odlyzko, Andrew. 2008. “Network neutrality, search neutrality, and the never-ending conflict between efficiency and fairness in markets.” Digital Technology Center, University of Minnesota.
- PricewaterhouseCoopers and Oxford Economics. 2016. “Capital project and infrastructure spending outlook: Agile strategies for changing markets 2016 edition.” Online. Accessed Febraury 2017. Available at: http://www.pwc.com/gx/en/industries/capital-projects-infrastructure/publications/cpi-spending-outlook.html
- PricewaterhouseCoopers and Oxford Economics. 2016. “Capital project and infrastructure spending outlook to 2025.” Online. Accessed Febraury 2017. Available at: https://www.pwc.com/gx/en/capital-projects-infrastructure/publications/cpi-outlook/assets/cpi-outlook-to-2025.pdf
- Sidak, J. Gregory. 2005. “A CONSUMER-WELFARE APPROACH TO NETWORK NEUTRALITY REGULATION OF THE INTERNET.” Journal of Competition, Law, and Economics. 2(3), 349-474.
- Siwek, Stephen E. “Measuring the U.S. Internet Sector.” Internet Association.
- SNL Kagan. 2017. “Tracking Cable’s Investment in Infrastructure.” Infographic. Online. Accessed Febraury 2017. Available at: https://www.ncta.com/industry-data/item/3199
- Manuel Trajtenberg, 2009. “Innovation Policy for Development: An Overview,” Chapters, in: The New Economics of Technology Policy, chapter 26 Edward Elgar Publishing.
- United States Federal Communications Committee. In the Matter of Preserving the Open Internet Broadband Industry Practices. “Net Neutrality Regulation: The Economic Evidence.” April 12, 2010. GN Docket No. 09-191. WC Docket No. 07-52. Washington, DC. 20554.
- (USPTO) United States Patent and Trademark Office. 2017. “Historical Patent Data Files (historical_masterfile).” Online. Accessed February 2017. Available at: https://www.uspto.gov/learning-and-resources/electronic-data-products/historical-patent-data-files
- United States Telecom Association, et al. v. Federal Communications Commission and United States of America. No. 15-1063. United States Court of Appeals for the District of Columbia Circuit. 2016. n.d. Online. Accessed April 2017. Available at: https://www.cadc.uscourts.gov/internet/opinions.nsf/3F95E49183E6F8AF85257FD200505A3A/%24file/15-1063-1619173.pdf
- USTelecom. 2016. “Broadband investment ticked down in 2015.” Presentation by Brogan, Patrick. Online. Accessed February 2017. Available at: https://www.ustelecom.org/sites/default/files/Broadband%20Investment%20Down%20in%202015.pdf
- Vogelsang, Ingo. 2013. “The Endgame of Telecommunications Policy? A Survey.” Jarbuch für Wirtschaftswissenschaften / Review of Economics. Bd. 64, H. 3, pp. 193-269.
- Waldmeir, Patti. 2006. “The net neutrality dogfight shaking up cyberspace.” Financial Times. March 23, 2006.
- Weissman, Robert. 2016. “The Administrative State: An Examination of Federal Rulemaking.” Written Testimony before the United States Senate Committee On Homeland Security and Government Affairs. April 20, 2016.
- Winseck, Dwayne and Jefferson D. Pooley. 2017. “A Curious Tale of Economics and Common Carriage (Net Neutrality) at the FCC: A Reply to Faulhaber, Singer, and Urschel.” International Journal of Communication. 11(2017). Feature 2702-2733.
- World Bank. 2017. World Development Indicators. Washington, DC.
- Wu, Tim. 2006a. “Why Have a Telecommunications Law-Anti-Discrimination Norms in
- Communications.” Journal on Telecommunications & High Technology Law. Vol. 5, pp. 15-46.
- Wu, Tim. 2006b. “Why you should care about network neutrality.” Slate Magazine.
- Yahoo Finance. Online. Accessed February 2017. Available at: http://finance.yahoo.com/
- Yoo, Christopher S. 2006. “Network Neutrality and the Economics of Congestion.” The Georgetown Law Journal. Vol. 94: 1847-1908.
- Yoo, Christopher S. 2017. “Avoiding the Pitfalls of Net Uniformity: Zero Rating and Nondiscrimination.” Review of Industrial Organization. (2017)50: 509.
- Yves Croissant, Giovanni Millo. 2008. “Panel Data Econometrics in R: The plm Package.” Journal of Statistical Software. 27(2). Online. Accessed February 2017. Available at: http://www.jstatsoft.org/v27/i02/.
Appendix A – Total Infrastructure Investment
Figure A1: Total Infrastructure Investment  Note: The graph shows a sharp drop from 2012 to 2014 for the total infrastructure investment of OECD countries not including the USA. However, this drop is due to dropped observations – not all the countries that had recorded data in 2012 currently have recorded data for 2013 and 2014. Running an alternative impact regression analysis utilizing observations for all OECD countries for total infrastructure investment (vs telecommunications infrastructure investment) produces a significant and positive result for the NN rules. In other words, total infrastructure investment in the United States was higher relative to other OECD countries after NN and this result was significant; however, since the results are not Telecom specific, the report mentions them here for reference rather than claiming positive causal impacts.
Appendix B – Regression Summary Tables
Table B1: Net Neutrality Effects on Telecommunications Infrastructure Investment (2010 Treatment)
| Dependent: Telecommunications Infrastructure Investment Per Capita | ||||||
|---|---|---|---|---|---|---|
| Baseline – Raw SE | Baseline – Robust SE | Controls – Raw SE | Controls – Robust SE | Lag – Raw SE | Lag – Robust SE | |
| (1) | (2) | (3) | (4) | (5) | (6) | |
| Constant (USA Dummy) | 115.0000*** | 115.0000*** | 144.1633*** | 144.1633*** | 175.9006*** | 175.9006*** |
| (7.9209) | (7.9191) | (23.9737) | (20.4617) | (42.3281) | (48.8772) | |
| Interaction | -11.1167 | -11.1167 | -14.1298 | -14.1298 | ||
| (12.6989) | (14.7722) | (22.4213) | (18.1080) | |||
| GDP Growth Pct | -20.9245 | -20.9245 | -235.0698 | -235.0698 | ||
| (91.3233) | (83.3658) | (161.2411) | (226.9852) | |||
| Population Growth Pct | 0.1192 | 0.1192 | 0.0224 | 0.0224 | ||
| (0.1059) | (0.0737) | (0.1870) | (0.1202) | |||
| Total Infrastructure Investment (per capita) | 11.5902** | 11.5902*** | 9.1924 | 9.1924 | ||
| (4.3477) | (3.6025) | (7.6763) | (5.4376) | |||
| Year FE | Yes | Yes | Yes | Yes | Yes | Yes |
| Observations | 48 | 48 | 48 | |||
| R2 | 0.9016 | 0.9485 | 0.8295 | |||
| Adjusted R2 | 0.7990 | 0.8727 | 0.5783 | |||
| F Statistic | 210.7867*** (df = 1; 23) | 70.0205*** (df = 5; 19) | 18.4923*** (df = 5; 19) | |||
| Note: | *p<0.1; **p<0.05; ***p<0.01 | |||||
Table B2: Net Neutrality Effects on Telecommunications Infrastructure Investment (2015 Treatment)
| Dependent: Telecommunications Infrastructure Investment Per Capita | ||||||
|---|---|---|---|---|---|---|
| Baseline – Raw SE | Baseline – Robust SE | Controls – Raw SE | Controls – Robust SE | Lag – Raw SE | Lag – Robust SE | |
| (1) | (2) | (3) | (4) | (5) | (6) | |
| Constant (USA Dummy) | 101.9667*** | 101.9667*** | 118.7412*** | 118.7412*** | 132.6085** | 132.6085*** |
| (7.5215) | (8.1979) | (28.2540) | (34.2109) | (50.1213) | (41.9285) | |
| Interaction | 52.1333*** | 52.1333*** | 45.8138 | 45.8138 | 78.0177 | 78.0177 |
| (15.0429) | (11.2869) | (29.2923) | (28.8886) | (51.9632) | (46.7847) | |
| GDP Growth Pct | -12.4026 | -12.4026 | -16.3196 | -16.3196 | ||
| (12.2692) | (14.5569) | (21.7649) | (15.7933) | |||
| Population Growth Pct | 17.5930 | 17.5930 | -169.4770 | -169.4770 | ||
| (91.4142) | (116.7978) | (162.1646) | (199.9078) | |||
| Total Infrastructure Investment (per capita) | -0.0410 | -0.0410 | -0.2504 | -0.2504 | ||
| (0.1446) | (0.1278) | (0.2566) | (0.2691) | |||
| Average Annual Interest Rate | 7.9553 | 7.9553* | 3.0023 | 3.0023 | ||
| (4.7924) | (4.5792) | (8.5015) | (5.6926) | |||
| Year FE | Yes | Yes | Yes | Yes | Yes | Yes |
| Observations | 48 | 48 | 48 | |||
| R2 | 0.9364 | 0.9547 | 0.8485 | |||
| Adjusted R2 | 0.8640 | 0.8817 | 0.6044 | |||
| F Statistic | 161.8530*** (df = 2; 22) | 63.1994*** (df = 6; 18) | 16.8032*** (df = 6; 18) | |||
| Note: | *p<0.1; **p<0.05; ***p<0.01 | |||||
Table B3: Net Neutrality Effects on Cable Infrastructure Investment (robustness check)
| Dependent: Cable Infrastructure Investment | ||||||
|---|---|---|---|---|---|---|
| Baseline – Raw SE | Baseline – Robust SE | Controls – Raw SE | Controls – Robust SE | Lag – Raw SE | Lag – Robust SE | |
| (1) | (2) | (3) | (4) | (5) | (6) | |
| Constant | 109,776,315,789.0000*** | 109,776,315,789.0000*** | 113,487,627,491.0000 | 113,487,627,491.0000 | 113,487,627,491.0000 | 113,487,627,491.0000 |
| (15,677,499,279.0000) | (16,540,589,627.0000) | (117,329,736,451.0000) | (179,217,264,559.0000) | (117,329,736,451.0000) | (179,217,264,559.0000) | |
| Interaction | 133,723,684,211.0000** | 133,723,684,211.0000*** | 24,682,193,980.0000 | 24,682,193,980.0000 | 24,682,193,980.0000 | 24,682,193,980.0000 |
| (50,800,903,812.0000) | (18,923,295,306.0000) | (19,004,879,489.0000) | (17,802,242,353.0000) | (19,004,879,489.0000) | (17,802,242,353.0000) | |
| GDP Growth Pct | -2,486,238,805.0000 | -2,486,238,805.0000 | -2,486,238,805.0000 | -2,486,238,805.0000 | ||
| (3,156,155,772.0000) | (6,882,629,143.0000) | (3,156,155,772.0000) | (6,882,629,143.0000) | |||
| Population Growth Pct | -284,319,187,588.0000*** | -284,319,187,588.0000** | -284,319,187,588.0000*** | -284,319,187,588.0000** | ||
| (84,278,414,318.0000) | (128,455,972,748.0000) | (84,278,414,318.0000) | (128,455,972,748.0000) | |||
| Total Infrastructure Investment (per capita) | 1,397,660,540.0000*** | 1,397,660,540.0000** | 1,397,660,540.0000*** | 1,397,660,540.0000** | ||
| (326,456,977.0000) | (481,889,100.0000) | (326,456,977.0000) | (481,889,100.0000) | |||
| Average Annual Interest Rate | 5,781,667,153.0000 | 5,781,667,153.0000 | 5,781,667,153.0000 | 5,781,667,153.0000 | ||
| (4,726,670,370.0000) | (7,014,331,314.0000) | (4,726,670,370.0000) | (7,014,331,314.0000) | |||
| Observations | 21 | 21 | 21 | |||
| R2 | 0.2672 | 0.9492 | 0.9492 | |||
| Adjusted R2 | 0.2287 | 0.9323 | 0.9323 | |||
| Residual Std. Error | 68,336,635,043.0000 (df = 19) | 20,248,239,734.0000 (df = 15) | 20,248,239,734.0000 (df = 15) | |||
| F Statistic | 6.9291** (df = 1; 19) | 56.0676*** (df = 5; 15) | 56.0676*** (df = 5; 15) | |||
| Note: | *p<0.1; **p<0.05; ***p<0.01 | |||||
Table B4: Net Neutrality Effects on Broadband Provider Capital Expenditure (robustness check)
| Dependent: Broadband Provider Capital Expenditures | |||
|---|---|---|---|
| Baseline | Controls | Lag SE | |
| (1) | (2) | (3) | |
| Constant | 73.3684*** | 40.1271 | 40.1271 |
| (3.8268) | (97.7492) | (97.7492) | |
| Interaction | 2.6316 | 3.5406 | 3.5406 |
| (17.1140) | (20.2279) | (20.2279) | |
| GDP Growth Pct | -1.1671 | -1.1671 | |
| (2.6292) | (2.6292) | ||
| Population Growth Pct | -17.9294 | -17.9294 | |
| (70.1620) | (70.1620) | ||
| Total Broadband Cap Expenditures (per capita) | 0.2023 | 0.2023 | |
| (0.2718) | (0.2718) | ||
| Average Annual Interest Rate | 5.9069 | 5.9069 | |
| (3.9331) | (3.9331) | ||
| Observations | 20 | 20 | 20 |
| R2 | 0.0013 | 0.2095 | 0.2095 |
| Adjusted R2 | -0.0542 | -0.0728 | -0.0728 |
| Residual Std. Error | 16.6807 (df = 18) | 16.8278 (df = 14) | 16.8278 (df = 14) |
| F Statistic | 0.0236 (df = 1; 18) | 0.7420 (df = 5; 14) | 0.7420 (df = 5; 14) |
| Note: | *p<0.1; **p<0.05; ***p<0.01 | ||
Table B5: Net Neutrality Effects on Total Inland Infrastructure Investment (Robustness Check)
| Dependent: Total Inland Investment | |
|---|---|
| Baseline | |
| Constant | 8,652,496,418.0000*** |
| (1,433,094,227.0000) | |
| Interaction | 7,312,458,725.0000*** |
| (2,676,066,643.0000) | |
| Observations | 674 |
| R2 | 0.8994 |
| Adjusted R2 | 0.8908 |
| Residual Std. Error | 5,105,068,598.0000 (df = 620) |
| F Statistic | 104.5508*** (df = 53; 620) |
| Note: | *p<0.1; **p<0.05; ***p<0.01 |
Appendix C – Alternative Impact Analysis Using CausalImpact R Package
Figure C1: OECD counterfactual, 2010  Figure C2: OECD counterfactual, 2015
  Figure C3: Regression estimate, 2010
 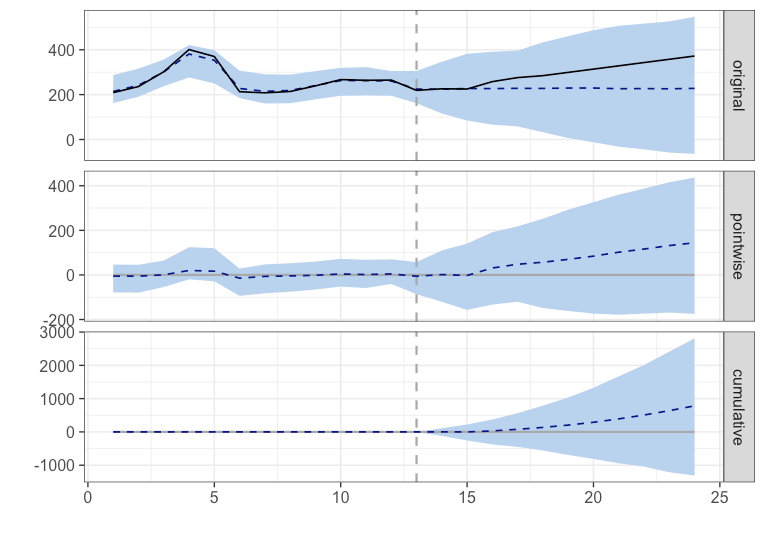 Figure C4: Regression estimate, 2015
 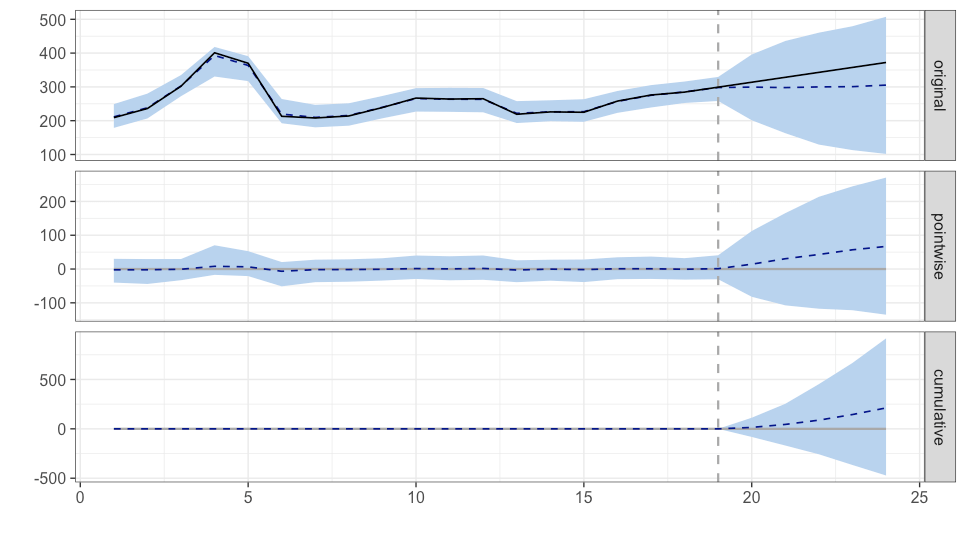 Figure C5: AR regression estimate, 2010
 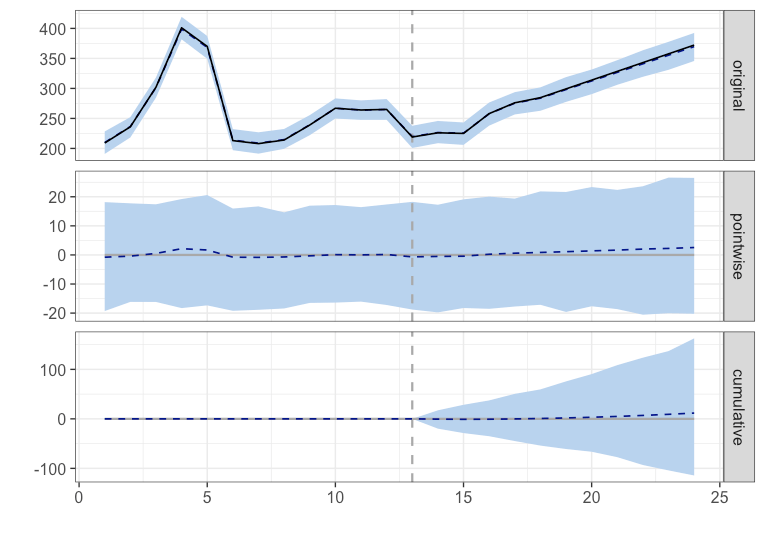 *Note: this graph illustrates singularity issues with the use of an auto-regressive term Note: No statistically significant impact is detected in any of the 5 specifications of the CausalImpact analysis
Figure C2: Summary Statistics
| Average | Cumulative | |
| Actual Prediction (s.d.) 95% CI | 343 324 (13) [299, 347] | 1715 1621 (64) [1494, 1737] |
| Prediction (s.d.) 95% CI | 19 (13) [-4.4, 44] | 94 (64) [-21.9, 221] |
| Prediction (s.d.) 95% CI | 5.8% (3.9%) [-1.3%, 14%] | 5.8% (3.9%) [-1.3%, 14%] |
| Posterior tail-area probability p: 0.064 Posterior prob. of a causal effect: 94% | ||
Figure C3: Summary Statistics
| Average | Cumulative | |
| Actual Prediction (s.d.) 95% CI | 299 227 (97) [43, 418] | 3284 2501 (1062) [474, 4593] |
| Prediction (s.d.) 95% CI | 71 (97) [-119, 255] | 783 (1062) [-1309, 2810] |
| Prediction (s.d.) 95% CI | 31% (42%) [-52%, 112%] | 31% (42%) [-52%, 112%] |
| Posterior tail-area probability p: 0.242 Posterior prob. of a causal effect: 76% | ||
Figure C4: Summary Statistics
| Average | Cumulative | |
| Actual Prediction (s.d.) 95% CI | 43 301 (71) [160, 437] | 1715 1503 (353) [799, 2187] |
| Prediction (s.d.) 95% CI | 42 (71) [-94, 183] | 212 (353) [-472, 916] |
| Prediction (s.d.) 95% Cl | 14% (23%) [-31%, 61%] | 14% (23%) [-31%, 61%] |
| Posterior tail-area probability p: 0.26735 Posterior prob. of a causal effect: 73% | ||
Figure C5: Summary Statistics
| Average | Cumulative | |
| Actual Prediction (s.d.) 95% CI | 299 297 (6.3) [284, 309] | 3284 3272 (69.4) [3121, 3398] |
| Prediction (s.d.) 95% CI | 1.1 (6.3) [-10, 15] | 11.7 (69.4) [-114, 163] |
| Prediction (s.d.) 95% CI | 0.36% (2.1%) [-3.5%, 5%] | 0.36% (2.1%) [-3.5%, 5%] |
| Posterior tail-area probability p: 0.42568 Posterior prob. of a causal effect: 57% | ||
Appendix D – Telecom Net Income, Equity, And Merger/Acquisition Values With Number Of Mergers
Appendix D – Telecom Net Income, Equity, And Merger/Acquisition Values With Number Of Mergers 
- The other, entitled “Principles To Preserve & Protect An Open Internet”, lays out IA’s detailed policy proposal on the matter. Available at: https://internetassociation.org/reports/principles-to-preserve-protect-an-open-internet/↩
- And to be clear NN rules do not prohibit zero-rating, which is allowed in the U.S.↩
- To clarify, the paper is referring to the current U.S. framework’s rules on blocking, throttling, paid prioritization, and transparency. Under NN, zero rating is not a per se violation and is not prohibited.↩
- This refers to the practice of charging other businesses for the ability to use an internet network while simultaneously charging consumers for the ability to access that business product/service.↩
- See “Net Neutrality: A Fast Lane to Understanding the Trade-offs” from Greenstein, Peitz, and Valleti (2016) for a comprehensive and up-to-date review.↩
- Available at: https://www.freepress.net/sites/default/files/resources/free_press_broadband_market_one_year_later.pdf↩
- Available at: https://www.freepress.net/sites/default/files/resources/internet_service_providers_capital_expenditures_2013-2016_reported_as_of_2_27_17.pdf↩
- Claims That the Open Internet Order Impaired Investment Lack Any Sound Theoretical or Factual Basis, https://www.fcc.gov/sites/default/files/true-invest.pdf (last accessed on May 13, 2017)↩
- There are further still research that has moved into more philosophical/theoretical questions such as an analysis of the definitions of “market competition” (Delp and Mayo, 2017), foremarkets and after-markets (Farrell, 2017), welfare gains and wealth transfers among internet industries (Hylton, 2016), the economic logic of NN (Katz, 2017), and equilibria effects of product/service differentiation (Yoo, 2016).↩
- This point is conceded by both sides of the debate; see Brennan (2017).↩
- As opposed to a NN ‘removal’ action, which would allow the paper to examine the theorized harms of discriminatory pricing, anti-competitive behavior, etc. ↩
- See Pil Choi and Kim (2010) for an examination of this logic.↩
- Note that telecommunications infrastructure investment figures are only available at an aggregate level past 2010 and not disaggregated by country apart from the US.↩
- Additionally, while other approaches such as synthetic controls and utilizing observations for multiple countries rather than simply an aggregate, analysis of this issue is limited by availability specifically on telecommunications infrastructure investment – this holds true for both sides of the debate. Consequently, the paper argues that the best approach is to mirror the telecom industry itself in comparison groups and data to ensure consistency.↩
- Such as Ford’s use of unrelated industries as comparators for the telecommunications industry.↩
- The use of forecasted data for impact evaluations is a flawed approach and is included here as a matter of due diligence. As noted, the primary focus of the paper is the 2010 treatment year and impacts calculated from any study for 2015 impacts should be interpreted cautiously given the inherent lag of infrastructure investment decisions and policy reactions (since they are planned in advance). Rather than claiming that any single analysis proves NN policy impact (such as other reports have done), this paper utilizes a series of tests that approaches the question with numerous variations to build a more robust and accurate picture. The burden in this instance falls on critics of NN to demonstrate negative investment impacts – a very difficult methodological feat.↩
- Based both on the auto-regressive technique and also on industry data from PricewaterhouseCoopers and Oxford Economics data (2016a; 2016b), which shows a very neutral forecast ranging from slight increase (approximately 0.5%) from 2015 to 2020 to slight decrease (approximately 5%) for U.S. and Canada telecommunications infrastructure spend through 2020 and strong growth in total global infrastructure investment through 2025 and total North American Infrastructure spending through 2020.↩
- Additionally, the apparent drop in total infrastructure investment in the OECD (minus the U.S.) from 2012-2014 shown in Figure A1 (appendix) is due to missing observations (some countries do not have data for 2013 and 2014). This again emphasizes the importance of the 2010 trigger date for which there are better data, the difficulty of determining impact from a single analysis test, and the use of total infrastructure investment as an alternative analysis. ↩
- It should be noted, however, that the paper argues 2010 treatment date is a more accurate implementation year given that it led firms to operate under NN assumptions and that the 2015 ruling reaffirmed the already existing practices. Furthermore, regressions using the 2010 treatment date use only observed data and no forecasts – a key weakness in any analysis that relies solely on 2015 as its trigger year. Again, 2015 is analyzed here as a matter of due diligence and since other groups claim the year as critical for infrastructure investment decisions.↩
- An issue that is even more complex and critical attempting to show negative impacts.↩
- According to the authors (pp. 74), “Abolishing NN results in underinvestment in infrastructure capacity by the ISP when both content providers pay the priority delivery charge, and either underinvestment or overinvestment when only one content provider pays the priority charge.”↩
- Without NN rules, they argued there would be a similar expansion of the investment incentive effect, though they note they are unsure which regime would have the larger incentive effect.↩
- The paper notes that the first scenario also assumes that broadband access providers would act in concert with one another to this end, something that would in itself raise significant antitrust concerns.↩
- Source: OECD, Broadband Portal, www.oecd.org/sti/broadband/oecdbroadbandportal.htm↩
- Source: OECD, Broadband Portal, www.oecd.org/sti/broadband/oecdbroadbandportal.htm, February 2017.↩
- https://www.ncta.com/data-stats↩
- It should be noted that peak employment for these professions (in the data available) was 2008, which reinforces the well-known cyclical nature of infrastructure investment as well as the argumentation and evidence of other groups, such as Free Press, which also found no evidence of negative impacts from NN rules.↩
- Annual corporate earnings were sometimes provided multiple times for a given year (due to changes in a company’s fiscal year), in which case the values from the month that best reflected a year’s worth of time from the previous report date was used.↩
- The last update noted at www.investsnips.com↩
- While a valid measure for examining a particular company’s performance over time, it was determined to be a problematic measure for purposes of aggregation across companies.↩
- The latter serving as a preview for future cycles since expiration dates extend well past the current year.↩
- Triadic patent families are patent groups that have been registered in various jurisdictions to protect the same invention. Typically, they are registered in the US, the EU, and Japan. They are used here to help account for potential influencing factor of patent trolls.↩
- For edge providers only there is a downward shift from beginning in 2012 through 2014.↩
- Apart from the reverse implications of the issues already discussed.↩