Dear internet stakeholders,
How do you build the next Silicon Valley?
It’s a question that policymakers, researchers, and the general public have tackled – with varying levels of success – over the last few decades. And for good reason.
Developing an internet sector is crucial to the economic success of any city or area in the 21st century, regardless of its size. Between 2007 and 2012, no other sector of the US economy had faster employment growth than the internet. In fact, the internet was well ahead of the pack, growing its share of national employment seven times more quickly than healthcare, the next closest sector. Between 2007 and 2014 the internet doubled its contribution to America’s economy from approximately 3 percent to 6 percent of GDP. We also saw similar growth in other countries with strong internet sectors.
The clear implication here is that policymakers should be positioning their business environment and labor forces to fully take advantage of the internet sector’s dynamism. Unfortunately, it is not always clear exactly how that can be done. While we have begun to develop accurate measures of the internet sector’s economic footprint, there is far less research on what policies and conditions can help develop or expand that footprint in a particular city, state, or region.
That mix of factors – the ingredients of a successful internet sector – is what we tackle here. To be clear, the authors do not suggest that every state and region must or should try to develop a ‘Silicon Valley.’ But there are some key conditions for policymakers to focus on that would help allow entrepreneurs, growing companies, and international businesses in the internet sector to thrive anywhere in the country.
This is not simply another run-of-the-mill ‘tech ranking’ – the research presented here offers a statically significant and theoretically robust analysis of environmental factors. Our goal isn’t to grade; it’s to educate – to work with policymakers to better understand how sectoral initiatives and economic development can grow the economy.
There’s no silver bullet for revitalizing lagging areas or further pushing growth in already prosperous areas. Butthe results in this study are clear and significant: fostering a strong internet business environment is an important step towards fostering a strong internet sector and building a strong local economies.

Christopher Hooton, Ph.D. Chief Economist Internet Association
Executive Summary
Goal: The purpose of this research effort is to identify and better understand the key factors that help determine the strength of an area’s internet economy. In particular, it is concerned with business environment factors.
Results: The analysis reveals the following key findings:
- A state’s internet business environment is strongly and positively correlated with both overall productivity and its internet sector productivity (measured by GDP per capita)
- A local area’s internet business environment strongly and significantly correlated with the number of internet sector firms and direct internet sector jobs
- Internet Accessibility is currently the single largest variant between leading states and lagging states
- The need for high quality Internet Accessibility and workforces skilled in IT has resulted in firms being forced to ignore other issues like cost barriers and regulations
- The top 10 states for doing internet business are:
| State Name | Ease of Doing Internet Business Index Score | Ease of Doing Internet Business Ranking |
|---|---|---|
| Colorado | 100.00 | 1 |
| Washington | 98.10 | 2 |
| Utah | 96.67 | 3 |
| Maryland | 91.90 | 4 |
| Massachusetts | 90.48 | 5 |
| Delaware | 90.00 | 6 |
| New Jersey | 89.52 | 7 |
| Connecticut | 89.52 | 7 |
| District of Columbia | 88.57 | 9 |
| California | 87.62 | 10 |
Method: The report analyzed four theoretical components: 1) Internet Business Environment, 2) Internet Accessibility, 3) Innovation Financing, and 4) General Business Governance. The report began through an index analysis of US states using 62 indicators and then built a more concise model using all US counties. The findings of the report hold up in several secondary analyses and are consistent with other findings on similar topics found in the literature.
Introduction
2.1 Purpose and goal
The purpose of this research effort is to identify and better understand the key factors that help determine the strength of an area’s internet economy. Put differently, it is an effort to better identify the ‘formula’ that distinguishes the U.S. internet sector and the areas that have best fostered the sector. In doing so, Internet Association, its members, and other stakeholders can begin to better leverage the power of the internet sector to boost local and state economies. And through its underlying analysis, the report presents an improved, data-driven approach to policymaking surrounding the internet.
“Measuring the Ease of Doing Internet Business in the United States” lays out the theoretical and analytical foundations of this exercise along with the results. The report does not measure the friendliness or unfriendliness of governments to specific types of internet business or activity (aka business models). Nor should the results here be interpreted as either an endorsement or condemnation of any specific regulation, law, or action taken by a government. Instead, they provide insight into how governments can improve the environment for innovative internet firms to thrive in their jurisdiction.
The report also lays the foundation for new models, new measurement approaches, and new policies that better recognize the unique and important contributions of the internet to the U.S. economy.
The report also lays the foundation for new models, new measurement approaches, and new policies that better recognize the unique and important contributions of the Internet to the U.S. economy. Perhaps more importantly, the individual metrics, subtopics, and themes of the analysis allow the Internet Association and policymakers to better understand the particular mechanisms for boosting state and local internet sectors. It is the Internet Association’s hope that through improved data and analysis the sector can move forward with governments in a cooperative manner and without ill-advised legislation driven by a lack of sector-specific education.
2.2 Research context
It is not uncommon to hear policymakers express desire to have their district area become the ‘next Silicon Valley’. Indeed, given the rapid growth of the technology sector, and the internet industry within that sector specifically,1it seems a logical goal to foster internet firms as a strategy for promoting economic growth and development.
Yet, while regional policy and industrial policy are well-known and longstanding tools in development, less research has examined the particular factors that help foster particular sector environments. There is burgeoning literature that has returned to the fundamental theory of place-based policy and, consequently, begun to empirically examine the economic potential of areas as a critical component of regional and industrial policy.2However, the research is limited and has typically adopted a general economic perspective, rather than examining influences on specific sectors. There has also been broader work on place-based strategies (e.g. Porter’s work on clusters; Florida’s work on the creative class, etc.) with an emphasis on the factors tied to specific geographies, but these too have focused on general growth strategies and unique, arguably one-of-a-kind clusters.
This paper offers an empirical examination of the specific factors that help foster internet firms and employment. It builds generally off two sets of works – the World Bank’s Doing Business reports and methodology, which examine business environmental factors for countries and subnational units, and the literature examining factors that affect the economic potential of places. We examine the internet industry specifically to allow for better defined analytical exercise – as opposed to a potentially methodologically unwieldy ‘tech’ sector generally –, building off the identification methodologies established by the sector’s trade association, the Internet Association.
This paper offers an empirical examination of the specific factors that help foster internet firms and employment.
First, we develop a theoretical conceptualization of the key factors for an internet business environment and develop a simple Ease of Doing Internet Business Index as an initial examination of correlation between factors and internet sector productivity using U.S. states. The results reveal a strong correlation between the four key environmental factors and the internet sector productivity of states and a sizeable, though expectedly smaller, correlation between these internet factors and overall productivity of an area.
Building off the first exercise, we develop a parsimonious model and run a series of OLS regressions using US counties to examine the relationship of these factors with internet sector employment and the number of internet sector businesses. These results reveal a strong and statistically significant correlation between key internet business environmental factors – generally categorized into four themes: 1) Internet Business Environment, 2) Internet Accessibility, 3) Innovation Financing, and 4) General Business Governance – and the number of internet establishments. We find a similar relationship between these factors and internet sector employment, though weaker and less significant, which we attribute to lower per firm employment in internet establishments than seen in other ‘traditional’ industries.
The findings suggest that the development of certain environmental factors can help foster a strong internet sector, though efforts will likely require time and sustained effort.
The report argues that these internet business environmental factors, and factors of economic potential more generally, should be seen as prudent first steps for policymakers – ones that can lay the foundation for future and more targeted policies such as tax incentives, public-private-partnerships, and others.
Conceptual Approach
3.1 Understanding ‘doing business’ indicators
Index scores are a popular method of analyzing factors. While approaches vary, they generally conduct some form of standardization of individual metrics to allow comparison of differing metrics with one another. This standardization process permits the identification of individual metrics, or collections thereof, that are most influential while allowing aggregated comparison.
The best approach to interpreting the results and their lessons is to consider each Theme and Subtopic area individually rather than focusing solely on the overall score.
While many index scores for places and organizations are converted into ‘rankings’ it is important to highlight a few things that can be misinterpreted. First, most index scores are relative, meaning that the 0-100 scale is dependent on the group of observations’ values and not some universal standard. The ‘best’ observation – in this report in reference to US states – has the best score relative to only the other groups observed. Second, because of the standardization process for variables, the weight or influence of individual metrics are often dampened. This is to prevent any single indicator or topic area from dominantly influencing the results. Third, while rankings can be developed from index scores with little effort, the report argues the best approach to interpreting the results and their lessons is to consider each Theme and Subtopic area individually rather than focusing solely on the overall score.
3.2 Defining the ‘internet’ business environment
The work presented here is focused on the internet. Consequently, the thematic areas and metrics chosen for this study switch out or modify traditional metrics of business environment studies for more precise measurements. For example, rather than market access (in general) – a typical indicator for business environment studies – the report utilized the subtopic area Internet Accessibility, which captures the same theoretical component of firm accessibility, but with more direct relevance for internet sector activity.
The report argues this change of perspective is crucial for better understanding the policy issues unique to the internet sector. As IA, its members, and numerous other experts have long argued, it is essential that the internet not be considered and regulated from the same perspective used for industries developed over a century ago. Indeed, the results of this research illustrate the vast improvement of using a ‘internet centric’ approach when considering the sector.
Specifically, the report conceptualizes four thematic components determining the ease of doing internet business:
- Internet Business Environment: the factors surrounding the development of new and existing internet businesses; captured through a combination of the subtopics:
- Internet Sector Strength
- General Economic Health
- Cost Barriers
- Internet Accessibility: the provision and quality of internet services available to businesses; captured through the subtopics:
- User Accessibility
- Internet Infrastructure Quality
- Innovation Financing: the provision of financing and investment from public and private sources specific to technology and research activity; captured through the subtopics:
- Research and Development
- Internet Investment
- General Investment
- General Business Governance: the general regulatory environment of an area for businesses; captured through the subtopics:
- Taxes
- Regulations
- Licensing
3.3 Thematic groupings
As identified above, the report collected data according to four Themes. Each of these Themes are, in turn, defined by several Subtopics (11 overall), which are then measured by a collection of individual Indicators. This hierarchical grouping allows the report to analyze the influence of each Indicator, Subtopic, and Theme on the internet business environment and also their relationships with other measures such as GDP. The relationship is illustrated below:

State Measurement
4.1 Data standardization and index score calculation
In total, the report collected 62 indicators for all 50 states and the District of Columbia. The target year for observation was 2014. Because differences in collection periods for certain datasets, 4 of the Indicators used observations for years other than 2014. The year 2008 was the observation year furthest from the target and only for 1 Indicator.
To compare these metrics across their various valuation standards and in order to develop Subtopic and Theme measurements, the report utilized two standardization approaches, which allow it to conduct an ‘apples to apples’ comparison.
First, it employed the distance to frontier linear transformation approach of the World Bank’s Ease of Doing Business unit and reports. This method transforms raw scores (e.g. a 6% unemployment rate) into a measurement of the gap in performance among the group. In other words, it measures how far a particular state is from the best state for each individual indicator. This approach was adopted in order to allow for absolute improvements by states over time as this analysis is updated and refreshed. The score is calculated using the following calculation:
(worst–y)/(worst–frontier)
where y is the observed value of each state, worst is the ‘worst’ value among all states, and frontier is the ‘best’ value among all states. The ‘best’ and ‘worst’ value scales are adjusted appropriately for each variable. For example, the ‘best’ value for unemployment would be the lowest figure while the ‘best’ value for GDP would be the highest figure.
In the next step, the report calculated quintiles for each variable and then assigned each distance to frontier score to its corresponding quintile so that each state received a 1, 2, 3, 4, or 5 for each Indicator with 5 being the best. Again, value scales were adjusted accordingly.
Finally, the report aggregated the quintile values for each indicator by Subtopic, then by Theme, and then aggregated the values for all 4 Themes together. The aggregated quintile values were converted to 0-100 Ease of Doing Internet Business Index scores (also referred to as EDIB scores) by dividing each state’s total by the maximum (best) value among all states.
4.2 State level results
The overall scores and the corresponding rankings for the top 10 states are given in Table 1 on the following page. Index scores were scaled from 0 to 100 with 100 being the best and rankings are from 1-51 with 1 (1st) being the best. Appendix A presents scores and rankings for each Theme for the top 10 states.
The decision to provide only the top 10 states from the exercise relates to the overall goal of the analysis. The report is focused on better understanding environmental factors important for the internet sector and finds little value in adding in lower rankings where fewer lessons can be learned.
The exercise finds the state of Colorado to be the best state for internet businesses to start, operate, and grow. The state has consistently strong performance across all four Themes and eleven Subtopics; it scored in the top ten states for eight of the 11 Subtopics and in the top 10 states for three of the four Themes. The environment is characterized by excellent (friendly) business governance with low taxes (both generally and for internet firms specifically), a friendly regulatory environment, and an easy process for starting a business. The workforce is highly skilled and offers a high concentration of the skillsets necessary for a thriving internet sector, all of which are bolstered by a dynamic state economy overall. Furthermore, the state offers a mature financial sector and a strong internet and tech investment environment along with high internet market access.
The next four states rounding out the top 5 are (in order): 2) Washington, 3) Utah, 4) Maryland, and 5) Massachusetts. Each of these states enjoy very high market access (internet accessibility) and strong investment environments that help fund innovative firms, which push them to the top tier of the list. However, they are beaten out for the top spot because of less friendly general business governance, which is marked by higher regulatory burdens, and or by weaker internet business environments.
The state of California, which serves as the informal benchmark in many minds, comes in as number 10 in the rankings. While it is the clear leader in many respects (especially in research and development and investment in innovation) it is hurt by a less friendly regulatory environment, and the size of the state which can mitigate the strength of strong local markets – i.e. it is important to remember that California is not the same as Silicon Valley.
Table 1: Top 10 Ease Of Doing Internet Business Index Scores And Rankings
| State Name | Ease of Doing Internet Business Index Score | Ease of Doing Internet Business Ranking |
|---|---|---|
| Colorado | 100.00 | 1 |
| Washington | 98.10 | 2 |
| Utah | 96.67 | 3 |
| Maryland | 91.90 | 4 |
| Massachusetts | 90.48 | 5 |
| Delaware | 90.00 | 6 |
| New Jersey | 89.52 | 7 |
| Connecticut | 89.52 | 7 |
| District of Columbia | 88.57 | 9 |
| California | 87.62 | 10 |
4.3 The importance of internet access
While overall scores are a useful starting point and consistent with expectations based on other general business environment studies (see Appendix B) and general knowledge of each state, it is essential that the Theme and Subtopic areas be examined to learn more about specific strength and weaknesses. Again, the purposes of this exercise are to better determine the key factors that drive a pro internet business environment and to help educate policymakers about how they can improve. Figure 1 provides a breakdown of each state’s overall score by Theme and Appendix C provides breakdowns of each state’s Theme score by its Subtopic areas. [infogram id=”https://infogram.com/edib_test-5560364″ prefix=”Ax9″] What becomes immediately clear is the importance of Internet Accessibility in determining a state’s ease of doing internet business score. All four Theme areas are important for a successful internet business environment, but Internet Accessibility shows the largest variation between leading states and lagging ones.3We see the correlation of the Themes and Subtopics with our index scores in Figures 2-5 and the stronger relationship of Internet Accessibility with the index score.
Internet Accessibility shows the largest variation between leading states and lagging ones.
Furthermore, the lower correlations of the other Themes and Subtopics indicate a level of consistency between states in the contribution of the other Themes and Subtopics. Consequently, this suggests that every state has solid potential to boost their internet sector’s performance through improved Internet Accessibility, which parallels anecdotal, though accepted, arguments by industry stakeholders that the internet increasingly opens up economic opportunity that is not tied to specific places.
Figure 2: Correlation Of Internet Business Environment With Ease Of Doing Internet Business
 Note: Shaded areas are 95% confidence intervals
Figure 3: Correlation of Internet Accessibility With Ease Of Doing Internet Business
 Note: Shaded areas are 95% confidence intervals
Figure 4: Correlation of Innovation Financing With Ease of Doing Internet Business
 Note: Shaded areas are 95% confidence intervals
Figure 5: Correlation of General Business Governance With Ease Of Doing Internet Business
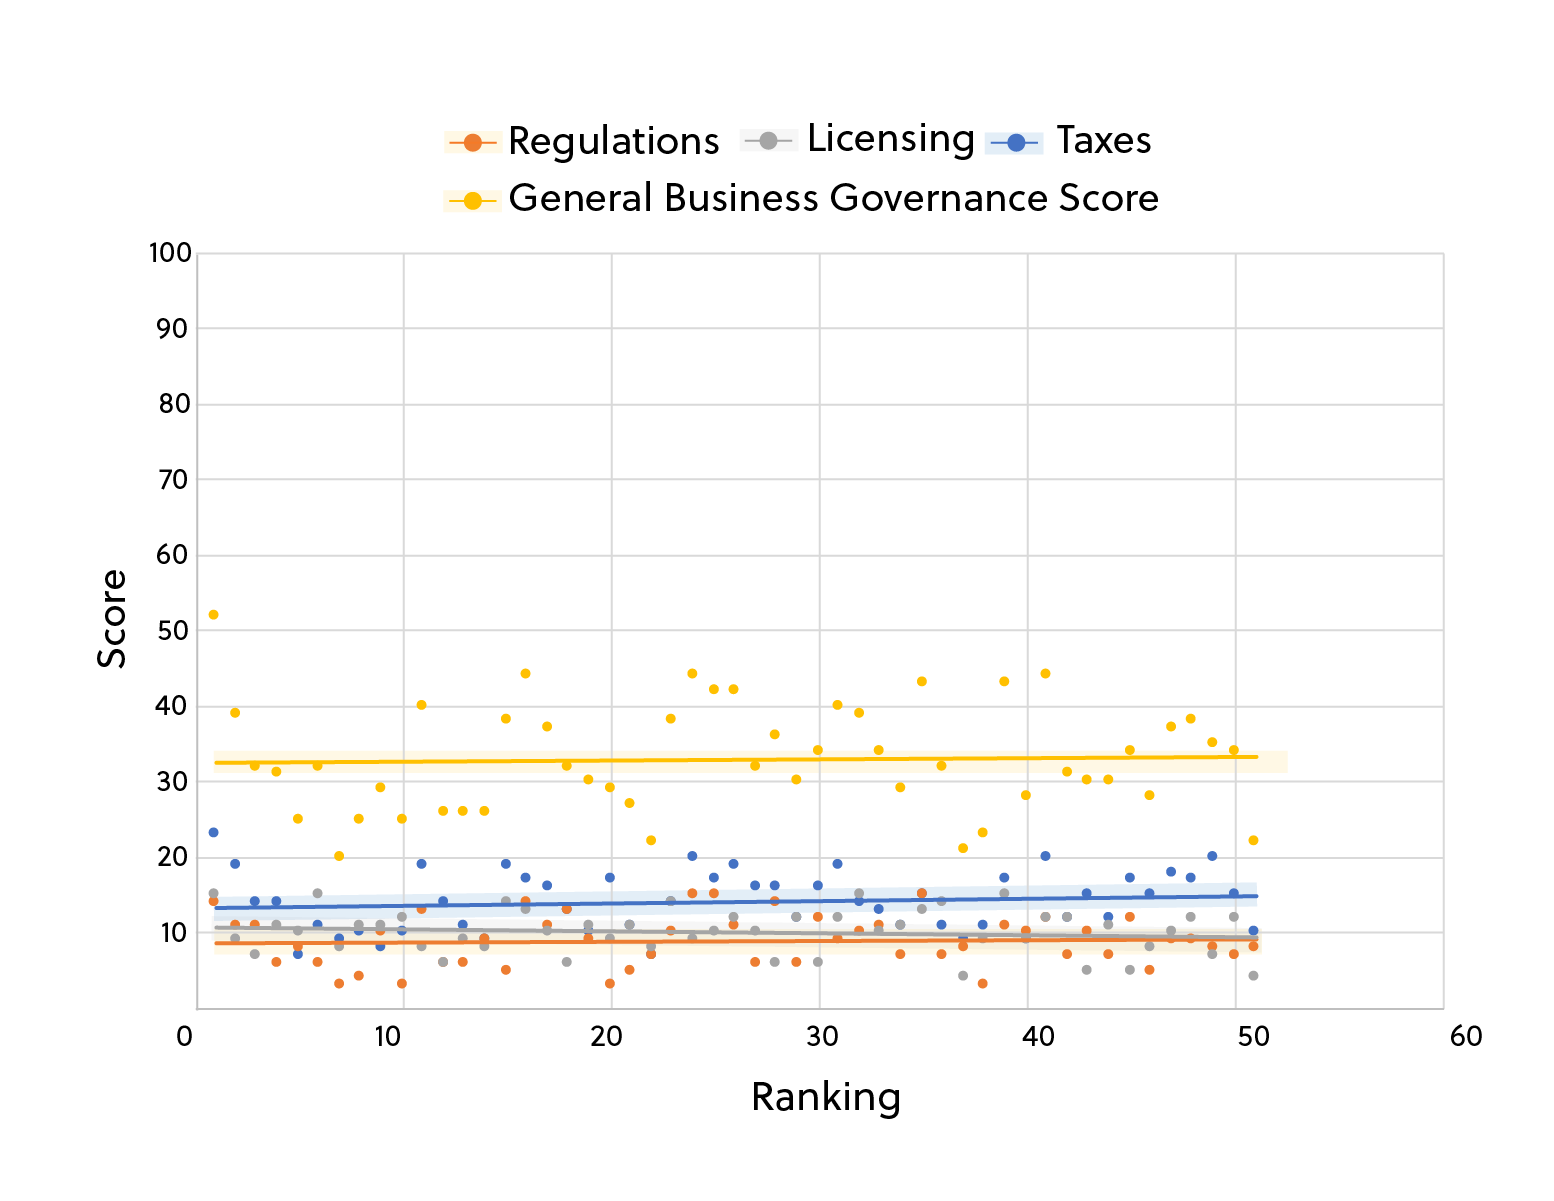 Note: Shaded areas are 95% confidence intervals
4.4 The cost of good internet access
Reinforcing the finding on the importance of Internet Accessibility, cost factors demonstrate a negative correlation with EDIB scores (Figure 2). Currently, the highest quality internet provision and highest levels of internet access are found in states with higher cost of living. This does not imply that internet businesses should move to areas that are more expensive; rather, it demonstrates that the importance of Internet Accessibility and workforce skill is great enough that it currently outweighs cost factors. The report demonstrates that this is largely due to the large discrepancy in internet access between leading states, which have much higher levels of access, but also higher cost of living, and lagging states, which have lower cost of living but have failed to develop robust access.
Internet access and the investment environment again outweigh other factors.
This is also demonstrated in the correlations of the 4 Themes with each other (Table 2).4General Business Governance shows a negative correlation with Internet Accessibility and Innovation Financing, while the other three Themes are all positively correlated with each other. This illustrates that internet access and the investment environment again outweigh other factors. Because of the large difference in Internet Accessibility between states and the concentration of the investment industry in certain cities, internet firms have been left with fewer options. By closing gaps in internet access, states can begin to better capitalize on their cost advantages, business governance advantages, and other competitive advantages while firms will be able to take advantage of the more business friendly environments.
Table 2: Correlation Of Theme Area Scores
| Internet Business Environment | Internet Accessibility | Innovation Financing | General Business Governance | |
|---|---|---|---|---|
| Internet Business Environment | 1.0000 | |||
| Internet Accessibility | 0.3386 | 1.0000 | ||
| Innovation Financing | 0.4694 | 0.4060 | 1.0000 | |
| General Business Governance | 0.0160 | -0.2303 | -0.2952 | 1.0000 |
We can see the beginning of this ‘rebalancing’ take place with the relocation of two former partners of Sequoia Capital (a Silicon Valley based venture capital firm) to Columbus, Ohio. The state of Ohio scores quite well in the EDIB index and is tied for the 15th best state in the rankings.However, the state’s friendly business governance regime and solid Innovation Financing opportunities are dragged down by middling levels of Internet Accessibility and, subsequently, a tepid Internet Business Environment. Keeping in mind the current report discusses conditions for 2014, we have seen improvements in the development of internet access and the internet sector environment in the state through proactive policies and the state’s resurgent private sector. As a result, Ohio is beginning to better capitalize on its other strengths as highlighted by the establishment of the new VC firm in Columbus along with the recent awarding of the federal Smart Cities grant to the city.
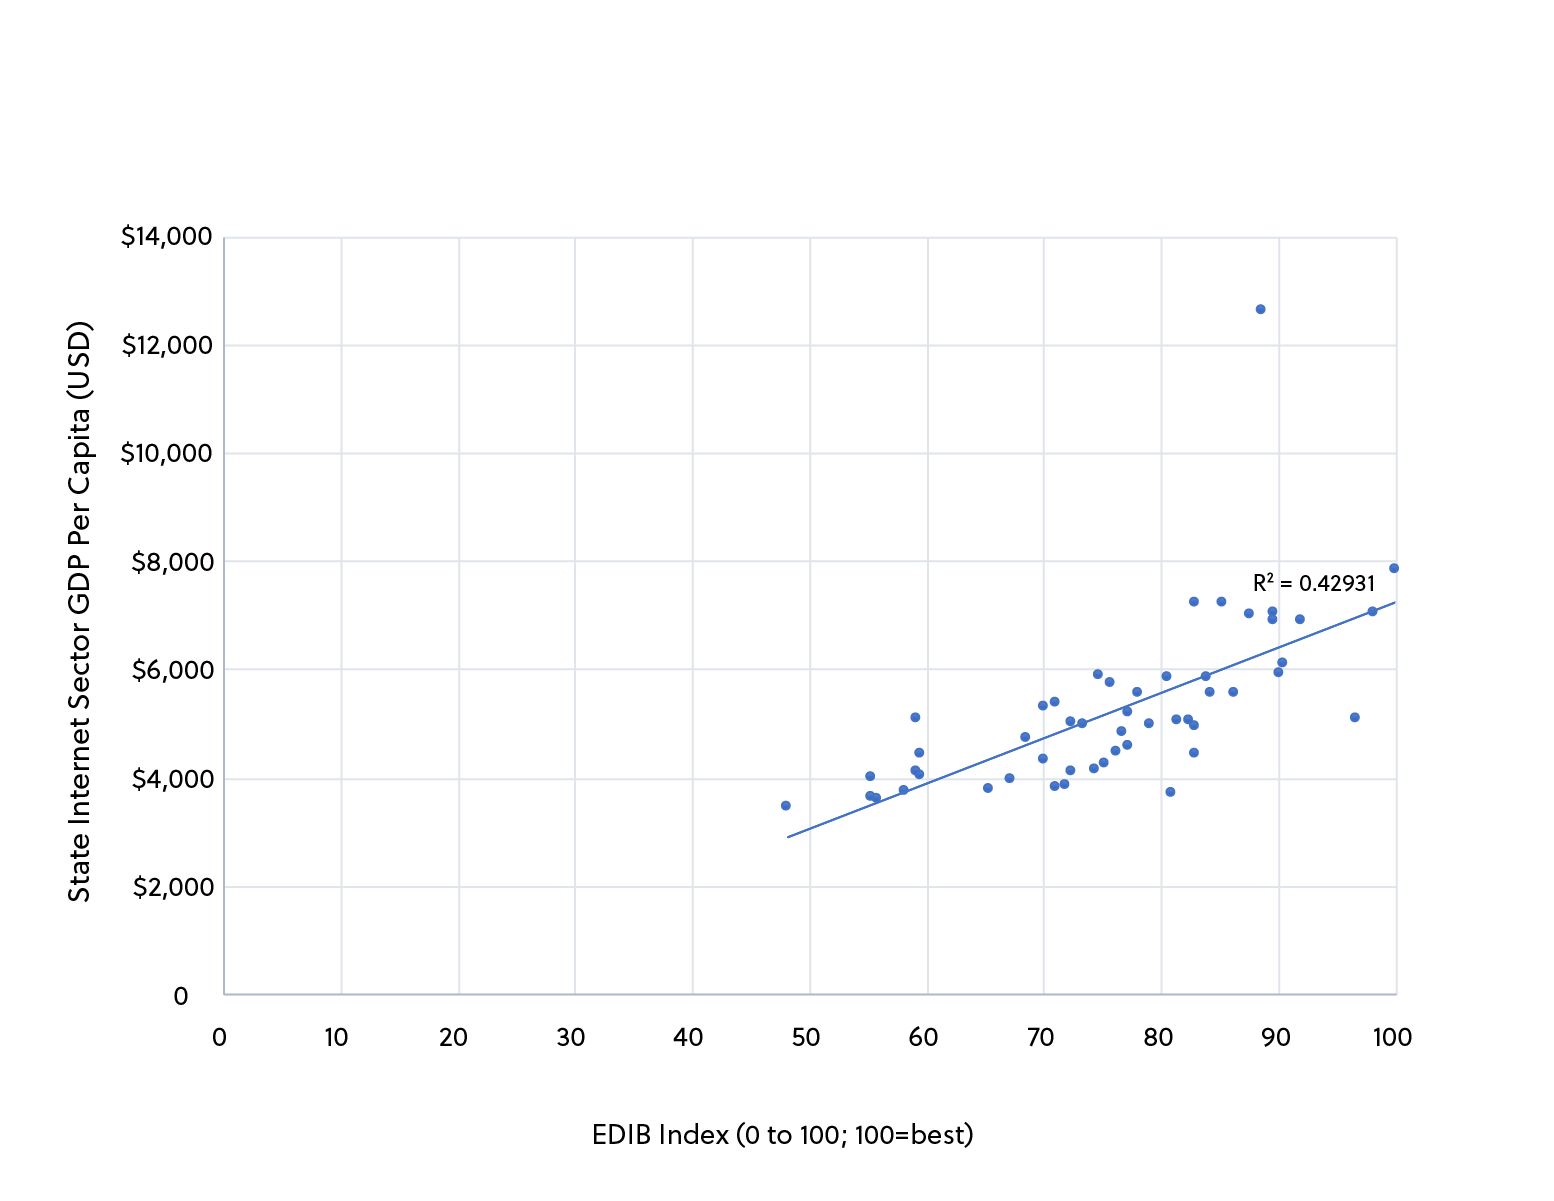
4.5 The importance of EDIB on a state’s economy
The importance of the internet sector to a country’s GDP is well documented, but the results here demonstrate that the ease of doing internet business is also a crucial factor for local area economic productivity. This is true for both overall productivity and internet sector productivity specifically.
Ease of doing internet business is also a crucial factor for local area economic productivity.
There are high, positive correlations for the Ease of Doing Internet Business scores with GDP per capita and Internet Sector GDP per capita. These are shown in Figures 6-7. These correlations confirm the robustness of the analysis, demonstrating the clear, expected link between an area’s business environment and its productivity. Friendly business environments are important for economic growth and internet friendly business environments are important for internet sector vitality. Furthermore, places with strong internet sectors are also more likely to have good general economic health.
Figure 6: State GDP Per Capita Versus Ease Of Doing Internet Business Index Score
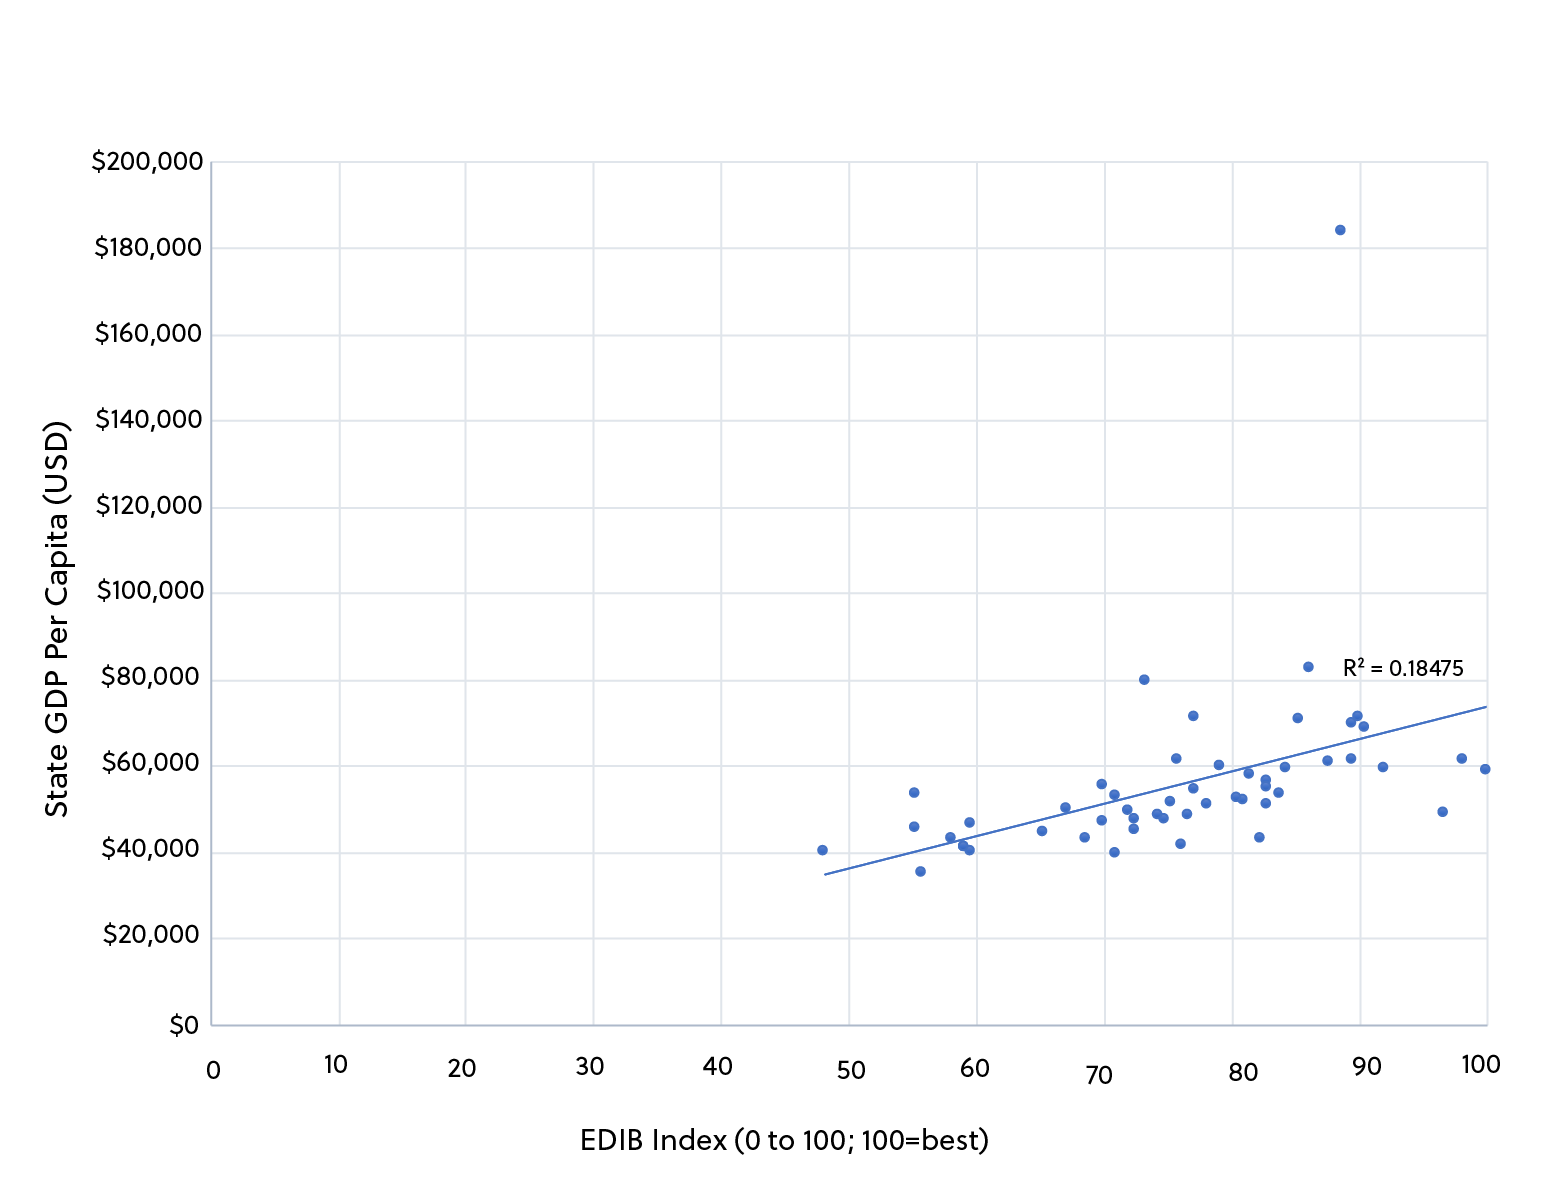
Figure 7: State Internet Sector GDP Versus Ease of Doing Internet Business Index Score
Modeling EDIB Using US Counties
5.1 Measurement approach
Building on the simpler state-level analysis, the report now extends its conceptual approach to county-level data in order to better understand how well the EDIB environmental factors affect internet sector economies at a more localized level and to further test the robustness of its results.
The current analysis incorporates a number of county and state-level variables in order to predict two county-level outcome variables: 1) percentage of internet workers in the workforce, and 2) percentage of internet establishments. Both of these outcome variables are sourced from the U.S. Census Bureau’s County Business Patterns (2014) which provides estimates on the number of establishments and employees in each of the approximately 3000 counties disaggregated by NAICS industries. The NAICS designations allowed to produce the percentage of internet establishments among all establishments and the percentage of employees in the internet sector among all employees.
Paring down from the original 62 metrics, a total of 12 variables, which coincide with the four central themes that comprise the Ease of Internet Business index were examined to determine the extent of their association with the outcome variable. Two additional variables (population and US region fixed effects), were included in the regression models as covariates. A full list of variables and their sources are shown in Table 3.
For clarification, the variable ‘Economic Diversity’ was produced using the percentage of establishments (from the American Community Survey) in each of the 24 broad industry categories (i.e., the first 2-digit NAICS designations) within each county. The percentages were converted to a Herfindahl-Hirschman Index (HHI), with large values indicating poor industry diversity.5Variables sourced from the American Community Survey are based on rolling surveys during a 5-year period, which is required to achieve reasonable estimation at the county-level.
Ordinary least squares (OLS) regression models were used for the current analysis. In order to account for correlated errors of counties (and, hence, heteroscedasticity), the regression coefficients were examined using robust standard errors (specifically, Huber-White heteroscedasticity-consistent standard errors). Since the use of robust standard errors do not affect coefficient estimation, model adequacy was determined using the standard R-squared statistic and the model F-test. The variance inflation factor (VIF) was also used as a measure of high correlation between predictor variables and Cook’s distances provided influence statistics.
The base R distribution provided was utilized to fit the OLS model and the generation of influence statistics.6 Additionally, robust standard errors were calculated using the R packages ‘lmtest’ and ‘sandwich’, and VIF statistics were generated using the ‘car’ package.789
Table 3: Regression predictors by thematic area
| Theme | Variable | Source |
|---|---|---|
| Internet Business Environment | Bachelors or Above % of workforce (C) | American Community Survey (2014, 5-Year) |
| Poverty Rate (C) | American Community Survey (2014, 5-Year) | |
| Economic Diversity (C) | County Business Patterns (2014) | |
| Cost of Living Index (S) | Council for Community & Economic Research: Cost of Living Index (2016) | |
| Internet Accessibility | % w/o High-Speed Internet: Urban (C) | FCC Broadband Progress Report (2016) |
| % w/o High-Speed Internet: Rural (C) | FCC Broadband Progress Report (2016) | |
| Average ICT Speed (S) | Akamai: State of the Internet Report (2014) | |
| Innovation Financing | RD Intensity (2013) (S) | National Science Foundation: Survey of State Government Research and Development (2015) |
| # Venture Capital Firms per Capita (S) | FindTheCompany.com: Compare Internet VC Firms (2016) | |
| State Bond Rating (S) | California Office of the State Treasurer: Comparison of Other States’ General Obligation Bond Ratings (2016) | |
| General Business Governance | Internet/Tech Incentive (S) | The Council for Community and Economic Research: State Business Incentives Database (2016) |
| % of Low-Income Occupations Licensed (S) | Institute for Justice: License to Work (2012) | |
| Average Business Registration Time (S) | Various State websites (e.g., State of Washington Business Licensing Service) (2008-2016) | |
| Controls | Population 2014 (C) | American Community Survey (2014, 5-Year) |
| US Region fixed effect | US Census Bureau |
Note: (C) indicates county-level aggregation and (S) indicates state-level aggregation
5.2 County analysis results
Once again, the analysis confirms the relationship between a friendly internet business environment and the strength of an area’s internet sector. Regardless of geographic scale, it is important in a 21st century economy to consider the conditions which best foster strong local economies and strong sectors. This holds true with the internet sector, the same as it has for older, more traditional sectors.
The analysis confirms the relationship between a friendly internet business environment and the strength of an area’s internet sector.
Utilizing a scaled back, but still theoretically consistent approach to that seen in the state level work, the report’s regression analysis demonstrates the importance of the four key theoretical components of an internet sector – Internet Business Environment, Internet Accessibility, Innovation Financing, and General Business Governance. For internet sector establishments, the full model has an r-squared of about 0.45, while for internet sector employment, the full model has an r-squared of about 0.14. These can be interpreted as the model explaining approximately 45% and 14% respectively of variation in internet establishments and employment between local economies. Particularly for the internet establishments (aka businesses), the model is an excellent predictor and is right in line with guidance from other economic potential and environmental conditions.10The model is suited to internet sector employment which relates to the sector’s higher labor efficiency levels and its primary design for business environment analysis.
Tables 4 and 5 present the results from the regressions. When interpreting the tables, the report suggests examining the variables as a ‘whole’ rather than focusing too much on any single variable. The report also emphasizes that the conditions are only part of the story; there are other factors at play that help determine an area’s economic health and internet sector strength. Similar to other research with similar approaches, the report does not attempt to determine one hundred percent of the economic differences between places; rather it is looking at economic potential – and in this case the internet sector potential –, which is a function of some key environmental conditions.
The percent of individuals without high-speed access is negatively and significantly correlated with internet sector establishments (and employment) in rural areas.
And while the environmental factors should be considered together, there are few individual predictors that merit note or explanation. The first of these is strength and significance of educational levels for internet sector strength – simply put, skilled workforces are important. Additionally, a more nuanced story has emerged in internet accessibility when we examine both rural and urban areas. As expected, the percent of individuals without high-speed access is negatively and significantly correlated with internet sector establishments (and employment) in rural areas, reinforcing the well-known value of expanding broadband access to all areas. However, within urban areas the measure is positively and significantly correlated. While impossible to discern exactly here, the report suggests that this relates to: 1) the higher cost of living of many leading internet cities; 2) higher and more concentrated variation in socioeconomic levels in urban areas as a result of the higher cost of living and which correspond with greater variation of services (i.e. in rural areas, wealth and poverty are more physically separated); and 3) the value of being located in vibrant internet business environments for firms. Put differently, the data show internet businesses value high quality internet access and a skilled workforce and will locate poorer neighborhoods of higher cost urban areas to be able to maximize their access to these. Finally, the analysis also shows an initially counterintuitive result that the intensity of research and development funding is negatively correlated with internet sector firms. The report argues that this is related to two factors: 1) that the largest internet sector areas in terms of pure output, employment, and establishments are also very populous – since R&D intensity is a per capita measure, this weakens its effect – and 2) that areas with less robust internet sectors are, rightly, investing in R&D as a strategy to bolstering their economies. Additionally, the report argues that private sector funding in leading internet areas may fill this function and thus alleviate the need for government R&D expenditure.
Table 4: Establishments Regression Results
| Dependent: % IT Establishments | ||||||
|---|---|---|---|---|---|---|
| Raw SE | Robust SE | Raw SE | Robust SE | Raw SE | Robust SE | |
| (1) | (2) | (3) | (4) | (5) | (6) | |
| Constant | -0.00850** | -0.00850* | -0.00482 | -0.00482 | -0.01282** | -0.01282* |
| (0.00356) | (0.00437) | (0.00528) | (0.00571) | (0.00621) | (0.00741) | |
| Bachelors or Above % of workforce (C) | 0.06196*** | 0.06196*** | 0.06188*** | 0.06188*** | 0.07288*** | 0.07288*** |
| (0.00254) | (0.00459) | (0.00254) | (0.00453) | (0.00286) | (0.00568) | |
| Economic Diversity (C) | 0.0000 | 0.0000 | -0.00000* | 0.0000 | 0.00000* | 0.0000 |
| (0.0000) | (0.0000) | (0.0000) | (0.0000) | (0.0000) | (0.0000) | |
| % w/o High-Speed Internet: Urban (C) | 0.00172** | 0.00172** | ||||
| (0.00083) | (0.00073) | |||||
| % w/o High-Speed Internet: Rural (C) | -0.00074 | -0.00074 | -0.00046 | -0.00046 | -0.00200* | -0.00200* |
| (0.00066) | (0.00072) | (0.00067) | (0.00073) | (0.00103) | (0.00104) | |
| Population 2014 (C) | 0.00000*** | 0.00000*** | 0.00000*** | 0.00000*** | 0.00000*** | 0.00000*** |
| (0.0000) | (0.0000) | (0.0000) | (0.0000) | (0.0000) | (0.0000) | |
| Poverty Rate (C) | 0.0011 | 0.0011 | -0.00951*** | -0.00951* | -0.02398*** | -0.02398*** |
| (0.00327) | (0.00426) | (0.00338) | (0.00516) | (0.00415) | (0.0053) | |
| Cost of Living Index (Index) (S) | 0.00002 | 0.00002 | 0.00004 | 0.00004 | 0.00004 | 0.00004 |
| (0.00002) | (0.00002) | (0.00003) | (0.00003) | (0.00004) | (0.00003) | |
| Average ICT Speed (S) | 0.00049*** | 0.00049*** | 0.00029* | 0.00029 | 0.00032 | 0.00032 |
| (0.00013) | (0.00016) | (0.00017) | (0.00021) | (0.0002) | (0.00025) | |
| RD Intensity (2013) (S) | -1.57112 | -1.57112 | -6.47856*** | -6.47856*** | -7.59860*** | -7.59860*** |
| (2.34678) | (2.09962) | (2.4392) | (2.18137) | (2.79549) | (2.52583) | |
| # Venture Capital Firms per Capita (S) | -6.89323 | -6.89323 | -11.23984 | -11.23984 | 2.50447 | 2.50447 |
| (6.0448) | (7.65271) | (8.99801) | (12.4263) | (10.58034) | (13.17759) | |
| State Bond Rating (S) | 0.00015 | 0.00015 | 0.00001 | 0.00001 | 0.00002 | 0.00002 |
| (0.0001) | (0.0001) | (0.00013) | (0.00012) | (0.00015) | (0.00013) | |
| Internet/Tech Incentive (S) | 0.00056*** | 0.00056*** | 0.00019 | 0.00019 | 0.00017 | 0.00017 |
| (0.00016) | (0.00019) | (0.00017) | (0.00019) | (0.00019) | (0.00021) | |
| % of Low-Income Occupations Licensed (S) | 0.00461** | 0.00461** | -0.00106 | -0.00106 | -0.00081 | -0.00081 |
| (0.00193) | (0.00198) | (0.00214) | (0.00221) | (0.00243) | (0.00234) | |
| Average Business Registration Time (S) | -0.00004* | -0.00004** | -0.00003* | -0.00003* | -0.00002 | -0.00002 |
| (0.00002) | (0.00002) | (0.00002) | (0.00002) | (0.00002) | (0.00003) | |
| Add Region? | No | No | Yes | Yes | Yes | Yes |
| Observations | 3,012 | 3,012 | 1,879 | |||
| R2 | 0.29738 | 0.33191 | 0.45781 | |||
| Adjusted R2 | 0.29433 | 0.32722 | 0.45138 | |||
| Residual Std. Error | 0.01005 | 0.00982 | 0.00901 | |||
| F Statistic | 97.60661*** | 70.73611*** | 71.23290*** | |||
Note: (C)=Country-level; (S)=State; Region is categorical; *p<0.1; **p<0.05; ***p<0.01
Table 5: Employment Regression Results
| Dependent: % IT Employees | ||||||
|---|---|---|---|---|---|---|
| Raw SE | Robust SE | Raw SE | Robust SE | Raw SE | Robust SE | |
| (1) | (2) | (3) | (4) | (5) | (6) | |
| Constant | -0.01857** | -0.01857** | -0.006 | -0.006 | -0.01473 | -0.01473 |
| (0.00823) | (0.00832) | (0.01245) | (0.01229) | (0.01367) | (0.01203) | |
| Bachelors or Above % of workforce (C) | 0.05869*** | 0.05869*** | 0.05540*** | 0.05540*** | 0.07236*** | 0.07236*** |
| (0.00588) | (0.0065) | (0.00598) | (0.0065) | (0.00629) | (0.00793) | |
| Economic Diversity (C) | 0.00001*** | 0.00001** | 0.00001*** | 0.00001* | 0.00001*** | 0.00001* |
| (0.00000) | (0.00000) | (0.00000) | (0.000000) | (0.00000) | (0.00001) | |
| % w/o High-Speed Internet: Urban (C) | 0.00272 | 0.00272* | ||||
| (0.00182) | (0.00145) | |||||
| % w/o High-Speed Internet: Rural (C) | -0.00058 | -0.00058 | -0.00043 | -0.00043 | -0.00493** | -0.00493** |
| (0.00153) | (0.00167) | (0.00159) | (0.00162) | (0.00227) | (0.00245) | |
| Population 2014 (C) | 0.00000*** | 0.00000** | 0.00000*** | 0.00000** | 0.00000*** | 0.00000** |
| (0.0000) | (0.0000) | (0.0000) | (0.0000) | (0.0000) | (0.0000) | |
| Poverty Rate (C) | -0.00699 | -0.00699 | -0.01400* | -0.014 | -0.01896** | -0.01896 |
| (0.00755) | (0.00896) | (0.00798) | (0.00923) | (0.00913) | (0.01163) | |
| Cost of Living Index (Index) (S) | 0.00009** | 0.00009* | 0.0001 | 0.0001 | 0.00008 | 0.00008 |
| (0.00004) | (0.00005) | (0.00007) | (0.00008) | (0.00008) | (0.00006) | |
| Average ICT Speed (S) | -0.00057* | -0.00057* | 0.00021 | 0.00021 | 0.00003 | 0.00003 |
| (0.00031) | (0.00034) | (0.0004) | (0.00042) | (0.00045) | (0.00045) | |
| RD Intensity (2013) (S) | 1.81654 | 1.81654 | 0.08994 | 0.08994 | 1.2279 | 1.2279 |
| (5.42892) | (4.67254) | (5.75049) | (4.78272) | (6.14915) | (5.29785) | |
| # Venture Capital Firms per Capita (S) | 2.91983 | 2.91983 | -34.84453 | -34.84453 | -23.06114 | -23.06114 |
| (13.98371) | (14.72994) | (21.21312) | (22.97008) | (23.27326) | (22.73602) | |
| State Bond Rating (S) | 0.00044* | 0.00044** | -0.00037 | -0.00037 | -0.00029 | -0.00029 |
| (0.00023) | (0.00019) | (0.00031) | (0.00026) | (0.00032) | (0.00026) | |
| Internet/Tech Incentive (S) | 0.00038 | 0.00038 | 0.00029 | 0.00029 | 0.00048 | 0.00048 |
| (0.00038) | (0.00034) | (0.0004) | (0.00036) | (0.00041) | (0.00038) | |
| % of Low-Income Occupations Licensed (S) | 0.0012 | 0.0012 | -0.00878* | -0.00878 | -0.00940* | -0.0094 |
| (0.00446) | (0.00509) | (0.00505) | (0.00551) | (0.00535) | (0.00698) | |
| Average Business Registration Time (S) | -0.00003 | -0.00003 | -0.00004 | -0.00004 | 0.00000 | 0.00000 |
| (0.00005) | (0.00004) | (0.00005) | (0.00004) | (0.00005) | (0.00006) | |
| Add Region? | No | No | Yes | Yes | Yes | Yes |
| Observations | 3,012 | 3,012 | 1,879 | |||
| R2 | 0.06343 | 0.07512 | 0.15141 | |||
| Adjusted R2 | 0.05937 | 0.06862 | 0.14135 | |||
Note: (C)=Country-level; (S)=State; Region is categorical; *p<0.1; **p<0.05; ***p<0.01
Table 6: VIF Statistics
| GVIF | df | GVIF(1/(2df) | |
|---|---|---|---|
| Bachelors or Above % of workforce (C) | 1.601 | 1 | 1.265 |
| Economic Diversity (C) | 1.344 | 1 | 1.159 |
| % w/o High-Speed Internet: Urban (C) | 1.682 | 1 | 1.297 |
| % w/o High-Speed Internet: Rural (C) | 2.133 | 1 | 1.461 |
| Population 2014 (C) | 1.193 | 1 | 1.092 |
| Poverty Rate (C) | 1.614 | 1 | 1.27 |
| Cost of Living Index (Index) (S) | 4.429 | 1 | 2.105 |
| Average ICT Speed (S) | 2.619 | 1 | 1.618 |
| RD Intensity (2013) (S) | 1.198 | 1 | 1.095 |
| # Venture Capital Firms per Capita (S) | 2.619 | 1 | 1.618 |
| State Bond Rating (S) | 2.174 | 1 | 1.474 |
| Internet/Tech Incentive (S) | 1.493 | 1 | 1.222 |
| % of Low-Income Occupations Licensed (S) | 1.628 | 1 | 1.276 |
| Average Business Registration Time (S) | 1.234 | 1 | 1.111 |
| Region (Categorical) | 54.333 | 8 | 1.284 |
Note: (C)=Country-level; (S)=State
Robustness Checks and Limitations
Based on the negative correlation observed between the four Theme areas, principal components analysis (PCA) using a forced one factor solution was conducted based on the sum quintile scores of the 11 subtopics (a PCA based on all 62 indicators using 51 cases was deemed unreasonable). The results of the PCA indicated four variables with negative or near zero standardized loadings on the first principal components: cost barriers, regulations, taxes, and licensing. Note that three of these variables comprise the entirety of the General Business Governance theme (regulations, taxes, and licensing) while a single variable was from the Internet Business Environment theme (cost barriers).
The business environment for internet firms within an area is strongly linked to the overall productivity and to the productivity of its internet sector.
The negative standardized loadings are analogous to the negative correlations we have already observed. As mentioned previously, the negative correlations are not particularly surprising given the locations in which internet businesses are currently located. At this point, the generation of a weighted index based on these standardized loadings were considered (including negative weights). However, in the context of an index, this procedure was deemed problematic. In general, we do not expect cost barriers, regulations, taxes, and licensing hurdles to facilitate the growth of businesses. Instead, it is clear businesses currently exist despite these conditions for other reasons that outweigh these negative factors. As such, a second PCA was conducted excluding the four variables and the weighted sum was produced. Interestingly, the index comprised of the weighted sum of the seven remaining variables was highly correlated with the full 11-variable unweighted index (r = 0.95). In the interest of simplicity, the full 11-variable unweighted index is presented in the current report. We will explore the possibility of future modifications based on these findings.
Presented as Appendix B, the paper lists the Ease of Doing Internet Business state rankings along with two general business environment rankings from CNBC and Forbes magazine. It also presents a ranking from the National Science Foundation on Science and Technology within states and a 1 to 4 score from the Consumer Technology Association on innovation.
Additionally, the paper re-ran its analysis utilizing an alternative index methodology approach. This alternative involved converting individual Indicator distance to frontier scores into standardized z-scores and then aggregating to find the alternative measure. The alternative approach, which allows more influence on overall rankings from individual Indicators, shows a strong linear relationship with the primary Ease of Doing Internet Business index score and rankings used by the repot. This is attached as Appendix D.
Other robustness checks involved developing a correlation matrix of all Indicators and Subtopics and running simple OLS regressions to confirm expected correlations.
In all of the secondary analysis checks, the paper found results consistent with the primary results presented here.
Policy Next-steps and Conclusion
While the information found in this study is insightful and useful, it must be utilized to have any impact. Business environments are not inherited and they are not static. Policymakers and the business community must constantly work toward improving and or maintaining conditions if they are to foster strong business communities.
Business environments are not inherited, and they are not static.
This is especially true with the internet sector where the speed of business and innovation changes rapidly and where low barriers to entry allow internet firms to operate with great geographical flexibility. The business environment for internet firms within an area is strongly linked to the its overall productivity and to the productivity of its internet sector. And as previous research from the Internet Association and other groups have proven, the internet sector is and will continue to be the driving force for economic growth long into the future.
The clear goal based on the findings of this research must be to improve internet accessibility across the country and across individual states. The installation and improvement of ICT infrastructure must be prioritized. Programs to increase internet access to families, households, individuals, and firms must be pursued with vigor. Gaps between urban and rural provision must be closed. Processing speeds must be optimized and access points in schools, libraries, homes, and elsewhere must be abundant.
By addressing these issues and closing the digital divide, states will then be able to take better advantage of their unique competitive and comparative advantages. As that happens, the Internet Association believes we will see a reinvigorated wave of innovation and growth from internet businesses that helps reduce geographically concentrated economic inequality.
Appendix
Appendix A: Scores and rankings by theme
| Ease of Int. Bus. Score | Ease of Int. Bus. Rank | Int. Bus Env. Score | Int. Bus Env. Rank | Int. Acc. Score | Int. Acc. Rank | Inno. Fin. Score | Inno. Fin. Rank | Gen. Bus. Gov. Score | Gen. Bus. Gov. Rank | |
|---|---|---|---|---|---|---|---|---|---|---|
| Colorado | 100.00 | 1 | 93.75 | 4 | 80.65 | 14 | 77.55 | 10 | 100.00 | 1 |
| Washington | 98.10 | 2 | 83.33 | 11 | 100.00 | 1 | 69.39 | 22 | 75.00 | 11 |
| Utah | 96.67 | 3 | 89.58 | 6 | 94.62 | 2 | 81.63 | 3 | 61.54 | 24 |
| Maryland | 91.90 | 4 | 75.00 | 25 | 93.55 | 4 | 79.59 | 6 | 59.62 | 29 |
| Massachusetts | 90.48 | 5 | 83.33 | 11 | 92.47 | 5 | 79.59 | 6 | 48.08 | 44 |
| Delaware | 90.00 | 6 | 83.33 | 11 | 83.87 | 12 | 79.59 | 6 | 61.54 | 24 |
| Connecticut | 89.52 | 7 | 72.92 | 27 | 94.62 | 2 | 91.84 | 2 | 38.46 | 51 |
| New Jersey | 89.52 | 7 | 79.17 | 20 | 92.47 | 5 | 79.59 | 6 | 48.08 | 44 |
| DC | 88.57 | 9 | 83.33 | 11 | 90.32 | 7 | 67.35 | 25 | 55.77 | 35 |
| California | 87.62 | 10 | 66.67 | 37 | 83.87 | 12 | 100.00 | 1 | 48.08 | 44 |
Appendix B: Internet Association rank comparison
| IA Ease of Doing Internet Business Rank | State | CNBC America’s Top States for Business 2016 | Forbes Best States for Business Rank | National Science Foundation Science & Technology Assessment | Consumer Technology Assoc. Innovation Scorecard* |
|---|---|---|---|---|---|
| 1 | Colorado | 3 | 5 | 2 | 2 |
| 2 | Washington | 6 | 10 | 18 | 2 |
| 3 | Utah | 1 | 1 | 9 | 1 |
| 4 | Maryland | 30 | 33 | 4 | 2 |
| 5 | Massachusetts | 20 | 18 | 6 | 1 |
| 6 | Delaware | 37 | 17 | 1 | 1 |
| 7 | Connecticut | 43 | 39 | 17 | 3 |
| 8 | New Jersey | 34 | 41 | 5 | 3 |
| 10 | California | 32 | 32 | 7 | 3 |
*Scores are assigned based on 4 categories: 1 = Innovation Champion, 2 = Innovation Leader, 3 = Innovation Adopter, 4 = Modest Innovator
- See “Refreshing our Understanding of the Internet Economy” at: https://internetassociation.org/reports/refreshingunderstandinginterneteconomyiareport/↩
- See the work of Mark Roberts on the development of an economic potential index; the work of Stuart Butler on Enterprise Zones.↩
- It should be noted that all Themes have approximately the same number of Indicators comprising them and, thus, similar potential for influencing scores.↩
- Please see Section 6 on the negative correlations reported in Table 2 and our checks on them.↩
- Hirschman, Albert O. (1964). “The Paternity of an Index”. The American Economic Review. American Economic Association. 54 (5): 761.↩
- R Core Team (2016). R: A language and environment for statistical computing. R Foundation for Statistical Computing, Vienna, Austria. URL: https://www.R-project.org/.↩
- Achim Zeileis, Torsten Hothorn (2002). Diagnostic Checking in Regression Relationships. R News 2(3), 7-10. URL: http://CRAN.R-project.org/doc/Rnews/↩
- Achim Zeileis (2004). Econometric Computing with HC and HAC Covariance Matrix Estimators. Journal of Statistical Software 11(10), 1-17. URL: http://www.jstatsoft.org/v11/i10/.↩
- John Fox and Sanford Weisberg (2011). An {R} Companion to Applied Regression, Second Edition. Thousand Oaks CA: Sage. URL: http://socserv.socsci.mcmaster.ca/jfox/Books/Companion↩
- ↩