Chief Economist’s Insight
We need better measures. We need better measures for the internet and other technologies and we need better measures on their impacts on our economy and society. The IA Industry Indicators (3I) Report is a new quarterly report from Internet Association that directly tackles the challenges of the 21st century economy by delivering new insights into America’s most dynamic economic sector – the internet. Providing both standardized metrics on and for the internet industry as well as commentary on the industry’s major trends, the 3I Report™ offers unique insights from the world’s only trade association that exclusively represents leading global internet companies on matters of public policy. In this inaugural issue, Internet Association opens the door to analysts, policymakers, stakeholders, and users into the internet’s very real and important economic contributions. In future editions, IA will dive deeper with looks at specific issues of the day as well as trends measured over time. These reports will shed crucial and up-to-date insights on a top-20 economic industry that contributes over six percent of gross domestic product, over three million jobs, and another 24 million online income positions to the U.S. economy. The IA Industry Indicators Report is one of a kind. The 3I Report offers five unique datasets on the internet sector: Macroeconomic Indicators based on US government datasets; Microeconomic Indicators based on publicly-traded internet company data; a new Digital Price Index measure based on common household digital goods; an internet Industry Risk Assessment on the major issues facing the internet industry; and an Internet Sentiment Survey, which offers insights into individual usership, expenditure, and preferences related to internet services and goods. Internet Association presents these data in a neutral manner through standardized tables and graphs. Internet Association accompanies that data with insightful commentary as the unified voice of the internet economy on what is happening to the internet and why it’s important. The data lag one to a few quarters depending on the source and the metric, but they provide the most up-to-date picture of this hard-to-capture industry and the trillions of dollar of value it provides. We cannot have informed conversations or perform rigorous analysis on the internet without better measurements. Internet Association is providing these data to help everyone better measure and, thus, better understand the internet as an economic sector and societal force.  Christopher Hooton, Ph.D. Chief Economist & Head Of Research Internet Association
Summary & Highlights
Consumers may not immediately think of the internet as an economic industry. They may instead think of it first and foremost as a tool, service, or technology. And they wouldn’t be entirely incorrect in doing so. The data compiled here, however, show just how foolhardy it is to ignore the internet as a major economic sector in the U.S. With trillions of dollars in market value, hundreds of billions in revenue, and millions of employees throughout every state, policymakers and other stakeholders would be wise to pay attention.
Revenue Machines
The internet industry posted strong revenue gains in Q2 2018. Aggregate revenue increased by a solid 3.7 percent quarter-over-quarter while median quarterly revenue increased 3.77 percent. Revenue from households drove these increases while the industry saw declines in revenue from businesses and from government; however, the declines reflect clear seasonality in industry revenue. Quarterly revenue change typically dips in Q1 and Q2 and rises through Q3 and Q4 each year (IA is developing a forthcoming, supplementary report that will examine the industry over time).
Most impressively, the internet industry’s annual revenue from businesses increased by 45.37 percent in 2017, speaking to the increasing utilization of digital and internet technologies by ‘traditional’ industries to improve efficiencies and open new markets.
Maturation & Growth
The strong revenue increases reflect a broader growth trend in the industry that has seen companies increasing their workforces, capital expenditures, and overall market value.
Hires increased by 18.43 percent and openings increased by 18.02 percent in Q2 2018. Simultaneously, separations decreased by 1.99 percent in the quarter. These figures indicate an increasing workforce and an increased retention of those workers within the industry. We are starting to see signs that workers who enter the industry are remaining, which runs counter to a popular perception of high turnover and volatility among dynamic startups. The dynamism is there, but also a robust labor market that supports its workforce.
This perhaps reflects large capital investment growth in the industry and massive capitalization increases by firms in the industry. Aggregate capital expenditures increased by 11.38 in Q2 2018, increasing over an already strong 13.98 percent increase in 2017. Meanwhile, market capitalization for the industry increased by 5.19 percent in Q2 2018 and by an impressive 57.33 percent in 2017.
Room For Growth
The internet industry also shows promising signs for sustained future growth. Internet Association’s user sentiment indicator, which measures internet users’ perception of the internet on a -1 to 1 scale with 0 being neutral and 1 being completely positive, measured the industry’s favorability at 0.373 for Q2 2018, showing a slight upward tick over the 0.371 in Q1 2018. Despite suggestive media coverage, the internet industry enjoys an 84 percent gross favorability (users view internet as at least partially good) and a net 67 percent favorability (favorable views minus unfavorable views) among its users. The user survey also reveals that the average American has increased personal time and personal spending on the internet over the last quarter. The average American spends about 2 hours, 41 minutes online for personal use each day and about $93 per month on personal internet goods and services – quarterly increases of 1.28 percent and 2.06 percent respectively.
Perhaps most importantly, the survey reveals two key aspects about future growth. First, Americans who actively use online platforms and apps for daily activities (e.g. Lyft for a ride out or Airbnb for a vacation), prefer them over their traditional substitutes (e.g. a taxi or hotel). Second, however, this share of active users still remains relatively small – most Americans still do not actively use many online platforms and apps. These two insights suggest plenty of room for continued growth in the industry’s customer base.
Issue Focus: Relentless Innovation
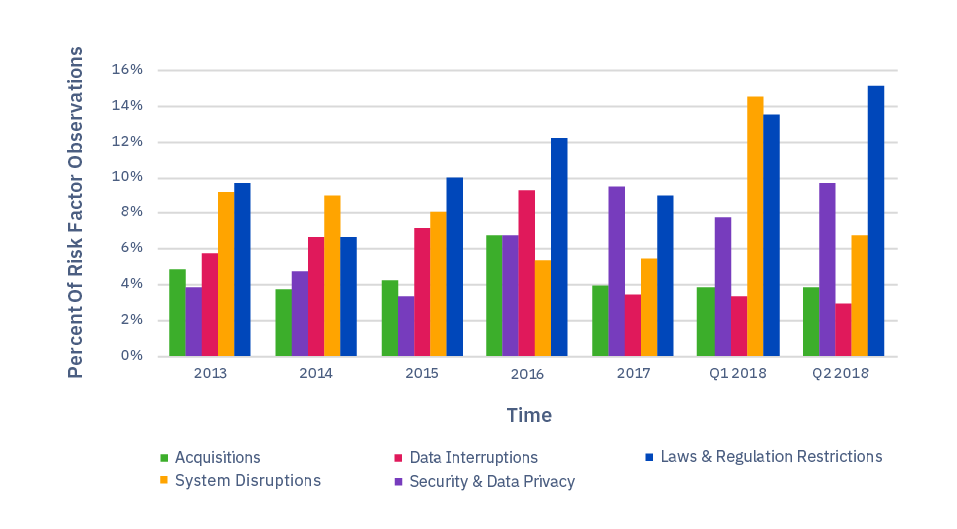
The internet sector continues to be a key driver of growth for the American economy. Between 2007 and 2014 the internet industry doubled its contribution to U.S. gross domestic product, from just under three percent in 2007 to six percent in 2014. Between 2007 to 2012 the industry’s share (contribution) of national employment also doubled, growing seven times faster than the second fastest industry, which was healthcare. And what’s the reason for this growth? Every successful internet business is keenly aware that their position (or positions, as the case may be) in the market is far from secure. In an analysis of publicly-traded internet companies over the past five years from 2013 to Q2 2018, IA identified the top five risks across all companies based on the number of times they were cited across every company’s public reports (see Table 1). From that analysis, the top risks to the industry were: 1) Product & Services Development, 2) Economic & Financial Conditions, 3) Competition, 4) Market, and 5) Customer Satisfaction & Subscription Rate. Three of those top five risks speak directly to the need to innovate and keep customers happy (Product & Services Development, Competition, and Customer Satisfaction & Subscription Rate). More than any other fundamental business aspect, the internet industry has been primarily focused on building products and services that keep customers happy and fend off fierce competition. This has even superseded perceived risks in market conditions, regulation, and system disruptions. The focus on innovation in the internet industry speaks to its underlying motivation to improve products, services, and processes that have become stale from time. It speaks to the goal to breath fresh competition into every corner of every market to the benefit of consumers. However, the analysis also revealed that the regulatory environment has become increasingly worrisome for internet companies since about 2015 (see Graph 2). While the internet industry has been able to focus on relentless innovation in pursuit of customer satisfaction, the landscape may be changing and hampering that pursuit in the future. Internet companies have frequently pointed out the importance of innovation to their business and policymakers have frequently noted its importance to overall economic growth and development. Aggregated assessments from internet businesses clearly reflect that sentiment through an overwhelming obsession with its customers and users. They also provide an early warning sign on the potential for restrictive regulation and policy to force firms away from customer focus to compliance focus.
Table 1: Most Commonly Cited Risks To Internet Sector Companies 2013 – Q2 2018
| Top 5 Internet Sector Risk Factors 2013 – Q2 2018 | Percent Of Risk Factor Observations |
|---|---|
| Product & Services Development | 31.17% |
| Economic & Financial Conditions | 20.55% |
| Competition | 18.03% |
| Market | 15.93% |
| Customer Satisfaction & Subscription Rate | 10.76% |
Notes: Table shows the citation frequency of the five most commonly cited risk factors over the period of 2013 to Q1 2018 among the five most important risk factors of every individual company.
Graph 1: Top Risk Factors (1-5) Citation Frequency Over Time

Graph 2: Top Risk Factors (6-10) Citation Frequency Over Time
Macroeconomic Indicators
Overview: Tables 2 and 3 provide information on the internet industry derived from North American Industrial Classification System (NAICS) codes. IA identifies the appropriate NAICS codes for inclusion through an internal identification methodology for the internet industry and the tables summarize quarter-over-quarter and year-over-year aggregate changes. See the methodology note below for more detail.
Table 2: Internet Industry Revenue
| Q2 2018 | Qtr-Over-Qtr Percent Change | Year-Over-Year Percent Change |
|---|---|---|
| Total Revenue (Sum) | 3.7% | 6.23% |
| Revenue From Businesses (Sum) | ^^^ | -45.37% |
| Revenue From Government (Sum) | -4.37% | -0.54% |
| Revenue From Households (Sum) | ^^^^ | -5.65% |
Notes: Reports most recent quarterly figures available at time of collection. Quarterly figures for Q2 over Q1 2018 changes. Yearly figures for 2017 over 2016 changes. ^^^Calculated figure is -210.46%; figure represents incomplete reporting within national datasets; likely inaccurate. ^^^^Calculated figure is 381.92%; figure represents incomplete reporting within national datasets; likely inaccurate.
Table 3: Internet Industry Employment
| Q2 2018 | Qtr-Over-Qtr Percent Change | Year-Over-Year Percent Change |
|---|---|---|
| Hires (Levels) | 18.43% | 7.71% |
| Hires (Rate) | 35.72% | 4.59% |
| Job Openings (Levels) | 18.02% | 31.5% |
| Job Openings (Rate) | 11.80% | 1.42% |
| Total Separations (Levels) | -1.99% | 7.11% |
| Total Separations (Rate) | -11.81% | 5.53% |
Notes: Reports most recent quarterly figures available at time of collection. Quarterly figures for Q2 over Q1 2018 changes. Yearly figures for 2017 over 2016 changes.
Microeconomic Indicators
Overview: Table 4 provides information on the internet industry derived from information reported by publicly-traded internet companies. IA identifies the appropriate businesses through an internal identification methodology and the tables summarize quarter-over-quarter and year-over-year aggregate changes. See the methodology note below for more detail.
Table 4: Internet Industry Financial Data, Annual
| Q2 2018 | Qtr-Over-Qtr Percent Change | Year-Over-Year Percent Change |
|---|---|---|
| Capital Expenditures (Absolute Value) | 11.38% | 13.98% |
| Capital Expenditures (Sum) | 11.38% | 23.1% |
| Market Capitalization (Sum) | 5.19% | 57.33% |
| Net Revenue (Sum) | 34.07% | 25.46% |
| Gross Revenue (Sum) | 26.19% | 22.66% |
| Employees (Sum) | -2.26% | 16.67% |
| Capital Expenditures (Average) | 11.38% | 23.1% |
| Market Capitalization (Average) | 5.07% | 53.5% |
| Net Revenue (Average) | 34.13% | 25.46% |
| Gross Revenue (Average) | 26.16% | 22.66% |
| Employees (Average) | 2.63% | 16.67% |
| Capital Expenditures (Median) | -37.11% | -8.74% |
| Market Capitalization (Median) | –18.45% | 16.91% |
| Net Revenue (Median) | -9.31% | 54.16% |
| Gross Revenue (Median) | 1.71% | 48.5% |
| Employees (Median) | 0% | 6.34% |
Notes: Reports most recent quarterly figures available at time of collection. Quarterly figures for Q2 over Q1 2018 changes. Yearly figures for 2017 over 2016 changes.
Digital Price Index
Overview: Table 5 provides information on Internet Association’s proprietary digital price index. The index tracks the prices of a typical basket of online, internet-based services and the table summarizes quarter-over-quarter and year-over-year aggregate changes. See the methodology note below for more detail.
Table 5: Digital Price Index
| Year-Over-Year Percent Change | Qtr-Over-Qtr Percent Change | |
|---|---|---|
| National Inflation | 2.1% | 0.98% |
|
Digital Price Index
|
5.28%
|
-3.16% |
Notes: IA examined three potential Digital Price Index (DPI) measures deciding on the third option, DPI 3, as the primary metric for the current and future reports. All DPI measures use a basket of common household internet services and products for individual consumers. DPI 1 is constructed by measuring the 3-month average of the sum monthly prices for all services and products divided by the total number of services. DPI 2 uses a 3-month average of monthly prices for a basket of consistent services and products available since 2005. DPI 3 uses a 3-month average of monthly prices for a basket of consistent services and products available since 2013. None of the indexes account for quality changes of services and products over time. IA provides information on year-over-year percent change for all three measures in this issue only for informational purposes, but will only track DPI 3 in future issues. National and quarterly inflation from US Bureau of Labor Statistics CPI-All Urban Consumers (Current Series). National Inflation reports annual average 12-month percent change for each year. Quarterly inflation reports aggregated 1-month percent change (not seasonally adjusted). Quarterly figures for Q2 over Q1 2018 changes. Yearly figures for 2017 over 2016 changes.
Internet Industry Risk Assessment
Overview: Table 6 provides information on Internet Association’s assessment of internet industry risk factors. IA aggregates reported risks from its member companies that are publicly-traded using quarterly reports and the tables summarize reported risks for the previous quarter and year. See the methodology note below for more detail.
Table 6: Most Commonly Cited Risks to Internet Sector Companies Q2 2018
| Top 5 Internet Sector Risk Factors Q2 2018 | Percent of Risk Factor Observations |
|---|---|
| Product & Services Development | 58.4% |
| Economic & Financial Conditions | 26.34% |
| Competition | 20.98% |
| Laws & Regulation Restrictions | 15.12% |
| Market | 12.68% |
| Top 5 Internet Sector Risk Factors Q1 2018 | Percent of Risk Factor Observations |
| Product & Services Development | 61.65% |
| Competition | 26.21% |
| Market | 21.84% |
| Economic & Financial Conditions | 14.56% |
| Laws & Regulation Restrictions | 13.59% |
Notes: Table shows the citation frequency of the five most commonly cited risk factors over the period of 2013 to Q1 2018 among the five most important risk factors of every individual company.
Internet User Sentiment
Overview: Table 7 provides information on Internet Association’s user sentiment survey. The table reports summarized responses from a U.S. national survey of internet users and presents information on the previous two quarters as well quarter-over-quarter changes.
Table 7: Internet User Sentiment Responses
| Q# | Question | Q1 2018 | Q2 2018 | Qtr-Over-Otr Percent Change |
|---|---|---|---|---|
| 1^^ | For personal use (i.e. not for your job/business/work), how much time on average per day do you spend using the internet? |
159.15 | 161.18 | 1.28% |
| 2^^ | For personal use, how much time on average per day do you expect to use the internet over the coming three months? |
192.19 | 191.46 | -0.38% |
| 3 | Filter/quality assurance question | |||
| 8 | Do you currently use online sites, platforms, or other internet tools to pursue passion projects and/or hobbies? Examples include selfpublishing a novel, selling crafts/art that you create, etc. |
29.40% | 31.29% | 1.89% |
| 9 | Is the internet essential for you to pursue these passion project(s) and/or hobby(ies)? |
24.15% | 26.21% | 2.06% |
| 10 | For personal use, how much money do you spend on average per month on all internet-based goods and services of any type? Please consider subscriptions, apps, games, shopping, movies, music, etc. |
$86.84 | $93.40 | 7.56% |
| 11 | For personal use, how much money do you expect to spend on average per month on all internet-based goods and services over the coming 3 months? |
$112.15 | $116.67 | 4.03% |
| Q# | Question^^^ | Q1 2018 | Q2 2018 | Quarterly Change |
| 4 | Do you spend more time using the internet in your personal life or for your work? |
0.279 | 0.246 | -0.033 |
| 5 | Do you spend more personal money shopping online or in (‘brick and mortar’/physical) stores? |
-0.111 | -0.115 | -0.004 |
| 6 | For personal use, do you use taxis more often or do you use ridesharing apps like Lyft, Uber, Via, and others? |
0.03 | 0.033 | 0.003 |
| 7 | Do you spend more personal time watching movies, TV, and other videos online or watching them on cable/satellite? |
-0.045 | -0.058 | -0.013 |
| 12 | Do you prefer staying in hotels or short-term rentals (e.g. Airbnb, HomeAway, other vacation rentals) for personal trips? |
-0.294 | -0.265 | 0.029 |
| 13 | Do you prefer conducting your personal banking and attending to personal finances online or in a physical, ‘brick-and- mortar’ bank? |
0.074 | 0.076 | 0.002 |
| 14 | Do you prefer meeting new people through online platforms, such as Match, Tinder, etc., or through offline interactions, such as blind-dates or at parties? Please consider both romantic dating and friendships. |
-0.537 | -0.515 | 0.022 |
| 15 | How do you view the internet’s contribution(s) to society? | 0.371 | 0.373 | 0.002 |
Notes: Question 3 is a filter question to ensure quality of responses.
^^Figures given in number of minutes.
^^^Figures given as an index with values ranging from negative one to positive one (-1 to 1). A value of negative one (-1) indicates the worst (negative) outcome for the internet industry. A value of zero (0) indicates a neutral sentiment that is equally good and equally bad for the internet. A value of positive one (1) indicates the best (positive) outcome for the internet industry.
IA Industry Indicators (3I) Report – Methodology Notes
Overview
Identification methodologies for the internet industry, technology sector, digital economy, and other synonymous terms have received little attention from academic researchers. The primary approach used by groups to identify ‘high-tech’ industries and companies overwhelmingly rely on expert panels, where individuals subjectively select which companies/industries are or are not part of ‘tech’.
IA’s general identification methodology is primarily based on a set of NAICS codes developed by an expert panel at Economists Incorporated in 2015. The method is in line with other ‘tech sector’ and digital economy identification methodologies, such as those issued by BLS, Brookings Institute, and others. The Internet Industry Indicators Report is primarily based on that methodology with adjustments where needed, such as in the case of weighting and or lesser detail levels. Further details on each set of indicators included in the 3I Report are given below:
Macroeconomic Data & Estimates
Macroeconomic data were derived from government datasets broken out by industry. IA utilized datasets for 3 to 6-digit NAICS codes based on IA’s internal identification methodology, which was developed by Economists Incorporated in 2015 using 2012 data. IA aggregated across these industry codes to develop approximations of industry totals and trends with weighted adjustments where necessary and possible.
IA Identification Methodology – Relevant NAICS Codes
| 2012 NAICS Title | IA NAICS Codes |
|---|---|
| Electronic Shopping | 45411 |
| Electronic Auctions | 454112 |
| Wireless Telecommunications Carriers (Except Satellite) | 5172 |
| Wired Telecommunications Carriers | 5171 |
| All Other Telecommunications | 517919 |
| Data Processing, Hosting, & Related Services | 518210 |
| Internet Publishing and Broadcasting & Web Search Portals | 51913 |
| Custom Computer Programming Services | 54151 |
| Computer Systems Design Services | |
| Computer Facilities Management Services | |
| Other Computer Related Services |
Microeconomic Data & Estimates
Microeconomic data were derived from publicly-traded internet companies and high-technology companies with significant internet-based revenues from a variety of sources including financial account reports, annual reports, and quarterly reports. All public IA member companies are included in this list as well as a set of other companies determined by IA using expert input and market analysis. IA identified 40+ publicly-traded internet companies in total at the time of data collection, which begins in the sixth week of each quarter with a one-quarter lag.
Digital Price Index Data & Estimates
IA developed its Digital Price Index using a basket of 11 internet services for which it found price data dating back to 2013. IA documented prices through online visits to the pricing detail pages of each service site using searches from its headquarters in Washington, DC. All searches are conducted on the same business day using the same computer and carried out in the sixth week of each quarter with a one-quarter lag. IA uses a 3-month average of monthly prices for this basket for quarterly estimates. The index does not account for quality changes of services and products over time. Where there are free options available for a particular service/good, IA uses the cheapest, premium subscription or per unit cost. Where there are no free options available for a particular service/good, IA uses the cheapest subscription or per unit cost. IA selected services/goods from a range of online activities to reflect a spectrum of typical online activities engaged in by users. IA emphasizes the fact that these are premium options and that many of the documented services include basic, free options as well. The current basket of services includes: Amazon Prime, Blue Apron, DropBox, Hulu, iCloud Storage, LinkedIn Premium, Netflix, New York Times, OneDrive, Spotify Premium, and Wall Street Journal. National and quarterly inflation from US Bureau of Labor Statistics CPI-All Urban Consumers (Current Series). National Inflation reports annual average 12-month percent change for each year. Quarterly inflation reports aggregated 1-month percent change (not seasonally adjusted). Quarterly figures for quarter over quarter changes. Yearly figures for year over year changes.
Risk Assessment Data & Estimates
IA develops its risk assessment utilizing 10-K and 10-Q filings from each of the public internet companies included in its microeconomic dataset. IA aggregates risk assessments from each company filing and standardizes across uniform categories of risk.
Internet User Sentiment & Estimates
IA conducts a national survey of the US general population utilizing SurveyMonkey panel service. IA runs the survey using a representative, statistically significant national sample of 1600+ respondents with no segment/demographic targeting and a 3% error margin.
Contact Us
Christopher Hooton, Ph.D. Chief Economist & Head of Research Internet Association economics@internetassociation.org The information contained herein is of a general nature and is not intended to address or identify, intentionally or unintentionally, any particular individual or entity. The information is derived using Internet Association’s internal methodologies and definitions for the internet industry to provide illustrative analysis only. Although IA attempts to provide as accurate of information as possible, there can be no guarantee that such information is accurate at any time now or in the future. The information reported is not intended as advice of any kind and Internet Association bears no responsibility for any influence from it or any decisions made as a result of the information contained herein.