Chief Economist’s Insight
This is Internet Association’s third IA Internet Indicators (3I) quarterly report, which tracks new and unique data on the internet industry.
In this issue, we focus on insights from IA’s digital price index (DPI) which tracks prices for typical internet services and how they compare to the national consumer price index.
The goal of the IA Internet Indicators report is to improve our understanding of the internet as an economic sector. We know the internet contributes massively to the U.S. and other economies around the globe, but we are just starting to piece together the details of the story – what drives the industry, how people use the internet, how broader trends impact the internet, etc. Numerous governments and other stakeholders are grappling with the same questions and issues and IA provides this report (along with its data) to help shed light on this dynamic sector.
The IA Internet Indicators report offers information from five perspectives: Macroeconomic Indicators based on US government datasets; Microeconomic Indicators based on publicly-traded internet company data; a new of Digital Price Index measure based on common household digital goods; an internet Industry Risk Assessment on the major issues facing the internet industry; and an Internet Sentiment Survey, which offers insights into individual usership, expenditure, and preferences related to internet services and goods. Internet Association presents these data in a neutral manner through standardized tables and graphs, which will be repeated in every issue. IA also provides a short summary and Industry Focus section concentrating on a particular aspect of the data to start each issue.
As we continue to refine our understanding of the internet industry from a measurement standpoint, IA will also revise this report as necessary to ensure as accurate of information as possible. IA notes all changes and any caveats clearly throughout the document in the appropriate section.
And as we all read and learn more about the internet as an economic sector, IA will continue to engage with partners and other stakeholders to share valuable insights.

Christopher Hooton, Ph.D.
Chief Economist & Head Of Research
Internet Association
Summary & Highlights
Employment
The internet sector increased its hiring in Q4 2018, indicating continued growth in the sector. The sector increased its Hires (levels) by 10.09 percent, which is more than double the Q3 2018 increase of 3.21 percent, despite a quarterly decrease of 1.5 percent in new Job Openings (levels). Total Separations (levels) also went down by nearly 10 percent, which reversed the quarterly increase seen in Q3 2018. Overall employment in the sector increased by 3.57 percent and average company employment increased by 6.16 percent according to IA’s microeconomic indicator dataset.
Digital Prices
Internet Association’s Digital Price Index (DPI) tracked closely with the national Consumer Price Index in Q4 2018 with a decrease of approximately 0.5 percent from the previous quarter. This was just below the CPI decrease of approximately 0.7 percent. The current issue of the 3I report provides a closer look at IA’s DPI.
Privacy, Security, & Stability
Aggregated risk assessments from internet sector firms indicate that two areas have been growing over the past year as concerns for the sector: “Economic & Financial Conditions” and “Security & Data Privacy.”
The internet sector cited risks related to “Economic & Financial Conditions” in approximately 23 percent of all reported risks cited in Q4 2018. The sector cited this risk in 22 percent of all reported risks in Q3 2018, 20.6 percent in Q2 2018, and in just 17 percent in Q4 2017. The steady increase suggests that broader macroeconomic conditions may be increasing as a potential concern for the industry.
The internet sector also increased its citation of “Security & Data Privacy” as a risk factor. This area appeared in 15 percent of all reported risks by the sector in Q4 2018 compared to just 9 percent a year earlier in Q4 2017.
Time & Money
IA recorded a slight decline in internet users’ personal time use and expenditure online in Q4 2018. Internet users decreased their average daily use of the internet to approximately 2 hours and 55 minutes compared to 3 hours and 1 minute in Q3 2018. Users’ online personal expenditures also decreased by approximately 1.59 percent from Q3 2018 down to approximately $89.97 per month.
Industry Leader: Internet Inflation
Internet Association began collecting a set of prices for internet services in Q1 2018 in preparation for the launch of its first 3I report in December 2018. The goal was to begin to monitor a typical basket of internet services that individuals use in their everyday life and to track those prices over time. In other words, IA was developing a digital price index (DPI).
This index can be used to compare how prices for internet services match up with prices in general and draw lessons about how the internet impacts individuals’ lives. This report offers the first look at the DPI in detail and reveals the following key findings:
- Internet services are not a universal depressor of overall prices
- There is more movement by typical digital prices for an average consumer than national prices
- In certain periods, IA’s DPI has tracked very closely with national inflation, but has also shown more fluctuation in recent quarters
- Even when more expensive services with more potential for large changes (i.e. outliers) are removed, the DPI still shows that online prices may actually increase faster than national prices
- Consumer choice is critical when it when it comes to the internet
- A change in price for a single service can have a large impact on the overall cost of a typical internet services basket to consumers
- The impact of individual price changes emphasizes the importance of free entry and exit between different online services – i.e. being able to pick and choose from month to month
IA shows these findings in Table 1 and Graph 1 on the next page. They provide measurements for IA’s DPI versus the National Consumer Price Index-All Urban Consumers (Current Series) for every quarter in 2018 and also for annual observations from 2003 to 2017 and then quarterly observations starting in 2018. Graph 1 also shows a scenario when an outlier service was removed.
It is important to note a few things regarding the DPI. First, IA uses it to track a basket of typical internet services and is not designed to be comprehensive of all internet services. IA uses the index to understand how an average individual might feel changes in prices to her/his favorite online services. Second, IA continues to develop the metric and will continue to refine it over time. One challenge in measuring the DPI is collecting back years of data on prices to allow any meaningful interpretation today. IA has done this and details its methodology at the end of the report; however, IA expects to be able to draw additional lessons and nuances with regular quarterly observations going forward.
Finally, IA experimented with a few different approaches to its DPI to get at a preferable approach. Its primary approach – reported here and in other 3i reports – tracked a set of online services that it could track back to 2013. IA sums the prices for these services together and then indexes them to a particular starting point in time. IA also did this for a smaller set of goods that it tracked back to 2005 and experimented with a different approach that tracked the average price of online services. IA felt the 2005 basket was too small and that the average price approach allowed too much distortion by single services. IA’s first 3I report (released December 2018) shows initial figures for these alternatives.
Table 1: Internet Association’s DPI Over 2018
| Q1 2018 | Q2 2018 | Q3 2018 | Q4 2018 | |
|---|---|---|---|---|
| DPI | 1.126 | 1.090 | 0.925 | 0.918 |
| National CPI | 1.071 | 1.081 | 1.083 | 1.078 |
| CPI (W/O Outlier) | 1.408 | 1.293 | 1.204 | 1.183 |
Graph 1: Internet Association’s DPI Versus CPI
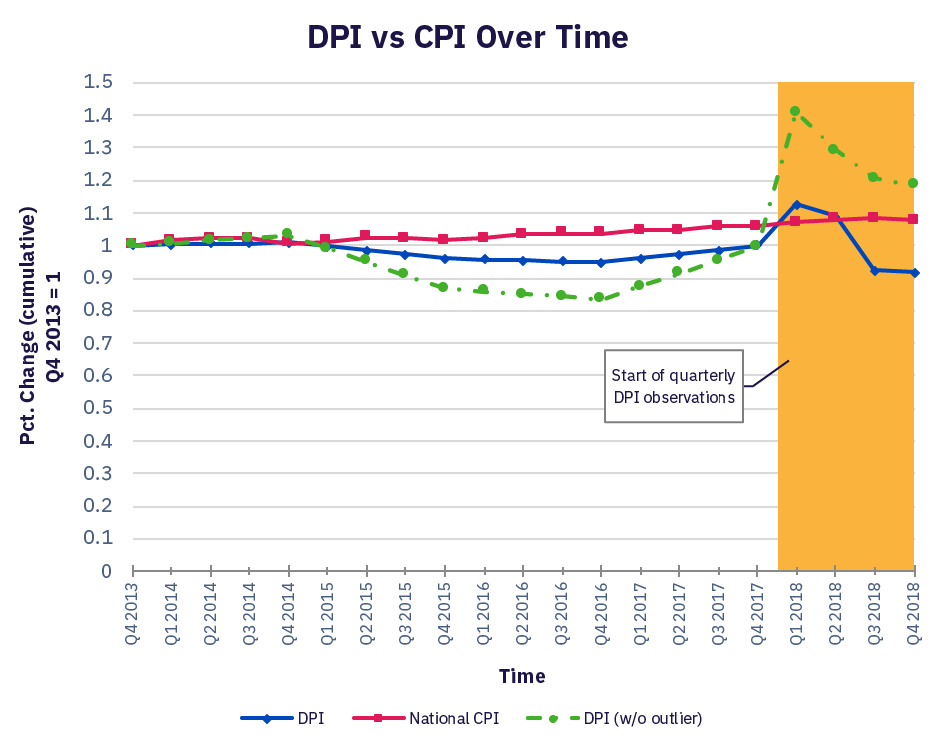
Notes: Graph shows IA’s DPI and national CPI for each year from 2013-2017 and then for each quarter from Q1 2018. The data series in green has removed an outlier service from the basket.
Macroeconomic Indicators
Overview: Tables 2 and 3 provide information on the internet industry derived from North American Industrial Classification System (NAICS) codes. IA identifies the appropriate NAICS codes for inclusion through an internal identification methodology for the internet industry and the tables summarize quarter-over-quarter and year-over-year aggregate changes. See the methodology note below for more detail.
Table 2: Internet Industry Revenue
| Qtr-Over-Qtr Percent Change | Year-Over-Year Percent Change | |
|---|---|---|
| Total Revenue (Sum) | 4.97% | 8.29% |
| Revenue From Businesses (Sum) | 2.87% | -39.44% |
| Revenue From Government (Sum) | 591.23% | 640.02% |
| Revenue From Households (Sum) | 1.11% | 0.86% |
Notes: Reports most recent quarterly figures available at time of collection. Quarterly figures for Q4 over Q3 2018 changes. Annual figures for Q4 2018 over Q4 2017.
Table 3: Internet Industry Employment
| Qtr-Over-Qtr Percent Change | Year-Over-Year Percent Change | |
|---|---|---|
| Hires (Levels) | 10.09% | 11.62% |
| Hires (Rate) | 187.46% | -12.26% |
| Job Openings (Levels) | -1.5% | 25.88% |
| Job Openings (Rate) | -177.32% | -87.05% |
| Total Separations (Levels) | -9.56% | 10.07% |
| Total Separations (Rate) | -173.14 | 41% |
Notes: Reports most recent quarterly figures available at time of collection. Quarterly figures for Q4 over Q3 2018 changes. Yearly figures for Q4 2018 over Q4 2017.
Microeconomic Indicators
Overview: Table 4 provides information on the internet industry derived from information reported by publicly-traded internet companies. IA identifies the appropriate businesses through an internal identification methodology and the tables summarize quarter-over-quarter and year-over-year aggregate changes. See the methodology note below for more detail.
Table 4: Internet Industry Financial Data, Annual
| Qtr-Over-Qtr Percent Change | Year-Over-Year Percent Change | |
|---|---|---|
| Capital Expenditures (Absolute Value) | 9.03% | 13.98% |
| Capital Expenditures (Sum) | 0.4% | 23.1% |
| Market Capitalization (Sum) | 7.6% | 57.33% |
| Net Revenue (Sum) | 45.64% | 25.46% |
| Gross Revenue (Sum) | 9.9% | 22.66% |
| Employees (Sum) | 3.57% | 16.67% |
| Capital Expenditures (Average) | 0.4% | 23.1% |
| Market Capitalization (Average) | 7.77% | 53.5% |
| Net Revenue (Average) | 45.15% | 25.46% |
| Gross Revenue (Average) | 9.95% | 22.66% |
| Employees (Average) | 6.16% | 16.67% |
| Capital Expenditures (Median) | -8.16% | -8.74% |
| Market Capitalization (Median) | 25.26% | 16.91% |
| Net Revenue (Median) | -7.19% | 54.16% |
| Gross Revenue (Median) | 1.16% | 48.5% |
| Employees (Median) | -13.93% | 6.34% |
Notes: Reports most recent quarterly figures available at time of collection. Quarterly figures for Q4 over Q3 2018 changes. Yearly figures for 2017 over 2016 change.
Digital Price Index
Overview: Table 5 provides information on Internet Association’s proprietary digital price index. The index tracks the prices of a typical basket of online, internet-based services and the table summarizes quarter-over-quarter and year-over-year aggregate changes. See the methodology note below for more detail.
Table 5: Digital Price Index
| Year-Over-Year Percent Change | Qtr-Over-Qtr Percent Change | |
|---|---|---|
| National Inflation | 2.1% | -0.7% |
| Digital Price Index | 5.3% | -0.5% |
Notes: The DPI measure uses a basket of common household internet services and products for individual consumers for which price data was available since 2013. IA collected annual prices for 2013-2017 and collects quarterly data starting in Q1 2018.
The index does not account for quality changes of services and products over time. National inflation figures come from U.S. Bureau of Labor Statistics CPI-All Urban Consumers (Current Series).
Quarterly figures for Q4 over Q3 2018 changes. Yearly figures for 2017 over 2016 changes. IA will report year-over-year changes starting with Q1 2019 data.
Internet Industry Risk Assessment
Overview: Table 6 provides information on Internet Association’s assessment of internet industry risk factors. IA aggregates reported risks from its member companies that are publicly-traded using quarterly reports and the tables summarize reported risks for the previous quarter and year. See the methodology note below for more detail.
Table 6: Most Commonly Cited Risks to Internet Sector Companies Q4 2018
| Top 5 Internet Sector Risk Factors Q4 2018 | Percent of Risk Factor Observations |
|---|---|
| Product & Services Development | 49% |
| Economic & Financial Conditions | 23% |
| Competition | 19% |
| Security & Data Privacy | 15% |
| Market | 13% |
| Top 5 Internet Sector Risk Factors Q3 2018 | Percent of Risk Factor Observations |
| Product & Services Development | 65% |
| Economic & Financial Conditions | 22% |
| Customer Satisfaction & Subscription Rate | 14% |
| Market | 12% |
| Security & Data Privacy | 11% |
| Top 5 Internet Sector Risk Factors Q4 2017 | Percent of Risk Factor Observations |
| Product & Services Development | 29% |
| Competition | 22% |
| Economic & Financial Conditions | 17% |
| Market | 15% |
| Security & Data Privacy | 9% |
Notes: Table shows the citation frequency of the five most commonly cited risk factors for Q3 2018 and Q4 2018 among the five most important risk factors of every individual company.
Internet User Sentiment
Overview: Table 7 provides information on Internet Association’s user sentiment survey. The table reports summarized responses from a U.S. national survey of internet users and presents information on the previous two quarters as well quarter-over-quarter changes.
Table 7: Internet User Sentiment Responses
| Q# | Question | Q3 2018 | Q4 2018 | Qtr-Over-Qtr Change |
|---|---|---|---|---|
| 1^ | For personal use (i.e. not for your job/business/work), how much time on average per day do you spend using the internet? |
181.58 | 175.45 | -3.37% |
| 2^ | For personal use, how much time on average per day do you expect to use the internet over the coming three months? |
216.11 | 207.98 | -3.76% |
| 3 | Filter/quality assurance question | |||
| 8 | Do you currently use online sites, platforms, or other internet tools to pursue passion projects and/or hobbies? Examples include self-publishing a novel, selling crafts/art that you create, etc. |
40.99% | 43.51% | 2.52% |
| 9 | Is the internet essential for you to pursue these passion project(s) and/or hobby(ies)? |
35.18% | 37.43% | 2.25% |
| 10 | For personal use, how much money do you spend on average per month on all internet-based goods and services of any type? Please consider subscriptions, apps, games, shopping, movies, music, etc. |
$91.42 | $89.97 | -1.59% |
| 11 | For personal use, how much money do you expect to spend on average per month on all internet-based goods and services over the coming 3 months? |
$119.21 | $128.31 | 7.63% |
| Q# | Question^^^ | Q3 2018 | Q4 2018 | Qtr-Over-Qtr Change |
| 4 | Do you spend more time using the internet in your personal life or for your work? |
0.234 | 0.190 | -0.044 |
| 5 | Do you spend more personal money shopping online or in (‘brick and mortar’/physical) stores? |
-0.0.41 | -0.014 | 0.027 |
| 6 | For personal use, do you use taxis more often or do you use ridesharing apps like Lyft, Uber, Via, and others? |
0.059 | 0.088 | 0.029 |
| 7 | Do you spend more personal time watching movies, TV, and other videos online or watching them on cable/satellite? |
0.053 | 0.095 | 0.042 |
| 12 | Do you prefer staying in hotels or short-term rentals (e.g. Airbnb, HomeAway, other vacation rentals) for personal trips? |
-0.252 | -0.254 | -0.018 |
| 13 | Do you prefer conducting your personal banking and attending to personal finances online or in a physical, ‘brick-and- mortar’ bank? |
0.129 | 0.166 | 0.037 |
| 14 | Do you prefer meeting new people through online platforms, such as Match, Tinder, etc., or through offline interactions, such as blind-dates or at parties? Please consider both romantic dating and friendships. |
-0.431 | -0.420 | 0.011 |
| 15 | How do you view the internet’s contribution(s) to society? | 0.405 | 0.419 | 0.014 |
Notes: Question 3 is a filter question to ensure quality of responses.
^Figures given in number of minutes.
^^Figures given as an index with values ranging from negative one to positive one (-1 to 1). A value of negative one (-1) indicates the worst (negative) outcome for the internet industry. A value of zero (0) indicates a neutral sentiment that is equally good and equally bad for the internet. A value of positive one (1) indicates the best (positive) outcome for the internet industry.
IA Industry Indicators (3I) Report – Methodology Notes
Overview
Identification methodologies for the internet industry, technology sector, digital economy, and other synonymous terms have received little attention from academic researchers. The primary approach used by groups to identify ‘high-tech’ industries and companies overwhelmingly rely on expert panels, where individuals subjectively select which companies/industries are or are not part of ‘tech’.
IA’s general identification methodology is primarily based on a set of NAICS codes developed by an expert panel at Economists Incorporated in 2015. The method is in line with other ‘tech sector’ and digital economy identification methodologies, such as those issued by BLS, Brookings Institute, and others. The Internet Industry Indicators Report is primarily based on that methodology with adjustments where needed, such as in the case of weighting and or lesser detail levels. Further details on each set of indicators included in the I3 report are given below:
Macroeconomic Data & Estimates
Macroeconomic data were derived from government datasets broken out by industry. IA utilized datasets for 3 to 6-digit NAICS codes based on IA’s internal identification methodology, which was developed by Economists Incorporated in 2015 using 2012 data. IA aggregated across these industry codes to develop approximations of industry totals and trends with weighted adjustments where necessary and possible.
IA Identification Methodology – Relevant NAICS Codes
| 2012 NAICS Title | IA NAICS Codes |
|---|---|
| Electronic Shopping | 45411 |
| Electronic Auctions | 454112 |
| Wireless Telecommunications Carriers (Except Satellite) | 5172 |
| Wired Telecommunications Carriers | 5171 |
| All Other Telecommunications | 517919 |
| Data Processing, Hosting, & Related Services | 518210 |
| Internet Publishing and Broadcasting & Web Search Portals | 51913 |
| Custom Computer Programming Services | 54151 |
| Computer Systems Design Services | |
| Computer Facilities Management Services | |
| Other Computer Related Services |
Microeconomic Data & Estimates
Microeconomic data were derived from publicly-traded internet companies and high-technology companies with significant internet-based revenues from a variety of sources including financial account reports, annual reports, and quarterly reports. All public IA member companies are included in this list as well as a set of other internet companies determined by IA using expert input and market analysis. IA identified 40+ publicly-traded internet companies in total at the time of data collection, which begins in the sixth week of each quarter with a one-quarter lag.
Digital Price Index Data & Estimates
IA developed its Digital Price Index using a basket of 11 internet services for which it found price data dating back to 2013. IA documented prices through online visits to the pricing detail pages of each service site using searches from its headquarters in Washington, DC. All searches are conducted on the same business day using the same computer and carried out in the sixth week of each quarter with a one-quarter lag. IA uses a 3-month average of monthly prices for this basket for quarterly estimates. The index does not account for quality changes of services and products over time. Where there are free options available for a particular service/good, IA uses the cheapest, premium subscription or per unit cost. Where there are no free options available for a particular service/good, IA uses the cheapest subscription or per unit cost. IA selected services/goods from a range of online activities to reflect a spectrum of typical online activities engaged in by users. IA emphasizes the fact that these are premium options and that many of the documented services include basic, free options as well. The current basket of services includes: Amazon Prime, Blue Apron, DropBox, Hulu, iCloud Storage, LinkedIn Premium, Netflix, New York Times, OneDrive, Spotify Premium, and Wall Street Journal. National and quarterly inflation from US Bureau of Labor Statistics CPI-All Urban Consumers (Current Series). National Inflation reports annual average 12-month percent change for each year. Quarterly inflation reports aggregated 1-month percent change (not seasonally adjusted). Quarterly figures for quarter over quarter changes. Yearly figures for year over year changes.
Risk Assessment Data & Estimates
IA develops its risk assessment utilizing 10-K and 10-Q filings from each of the public internet companies included in its microeconomic dataset. IA aggregates risk assessments from each company filing and standardizes across uniform categories of risk.
Internet User Sentiment & Estimates
IA conducts a national survey of the US general population utilizing SurveyMonkey panel service. IA runs the survey using a representative, statistically significant national sample of 1600+ respondents with no segment/demographic targeting and a 3% error margin.
Contact Us
Christopher Hooton, Ph.D.
Chief Economist & Head of Research
Internet Association
economics@internetassociation.org
The information contained herein is of a general nature and is not intended to address or identify, intentionally or unintentionally, any particular individual or entity. The information is derived using Internet Association’s internal methodologies and definitions for the internet industry to provide illustrative analysis only. Although IA attempts to provide as accurate of information as possible, there can be no guarantee that such information is accurate at any time now or in the future. The information reported is not intended as advice of any kind and Internet Association bears no responsibility for any influence from it or any decisions made as a result of the information contained herein.