Chief Economist’s Insight
This is Internet Association’s second IA Industry Indicators (3I) quarterly report, which tracks new and unique data on the internet industry. In this issue, we focus on the American public’s sentiment toward the internet and provide updates to our standard data tables. The most striking finding this quarter was the consistent rise every quarter of public sentiment toward the internet.
The goal of the IA Industry Indicators report is to improve our understanding of the internet as an economic sector. We know the internet contributes massively to the U.S. and other economies around the globe, but we are just starting to piece together the details of the story – what drives the industry, how people use the internet, how broader trends impact the internet, etc. Policymakers, academics, and other stakeholders are grappling with these same questions and issues, and IA provides this report (along with its data) to help shed light on America’s most dynamic sector: the internet.
The 3I report offers information from five perspectives: Macroeconomic Indicators based on US government datasets; Microeconomic Indicators based on publicly-traded internet company data; a new of Digital Price Index measure based on common household digital goods; an internet Industry Risk Assessment on the major issues facing the internet industry; and an Internet Sentiment Survey, which offers insights into individual usership, expenditure, and preferences related to internet services and goods. Internet Association presents these data in a neutral manner through standardized tables and graphs, which will be repeated in every issue. We also provide a short summary and Industry Focus section concentrating on a particular aspect of the data to start each issue.
As we continue to refine our understanding of the internet industry from a measurement standpoint, IA will also revise this report as necessary to ensure as accurate of information as possible. We will note all changes and any caveats clearly throughout the report.
And as we all read and learn more about the internet as an economic sector, We’ll continue to engage with partners and other stakeholders to share valuable insights.

Christopher Hooton, Ph.D.
Chief Economist & Head Of Research
Internet Association
Summary & Highlights
Industry Performance
The internet industry demonstrated a mixed performance in Q3 2018. Gross revenue showed a slight decrease of approximately 0.8 percent in the macroeconomic dataset, but strong growth of over 39 percent in the microeconomic dataset. Net revenue was also down over 21 percent in the microeconomic data.
It is important to note the discrepancy in figures between those estimated using IA’s macroeconomic approach and those using IA’s microeconomic report. IA argues the discrepancy can be attributed to three things. First, the macroeconomic dataset draws on data for all U.S. businesses that operate under one of the internet-relevant NAICS codes identified by IA, while the microeconomic dataset draws on data from only the several dozen companies that comprise IA’s membership along with their competitors. Second, the macroeconomic approach suffers from the same issues as any other expert-panel identification methodology for technology: it misses internet businesses that reside in ‘unintuitive’ NAICS codes. For example (this is not confirmed by IA), there is a strong possibility that ride-sharing companies fall under the transportation NAICS codes, which IA does not include in its identification methodology. Third, the macroeconomic data is not yet fully issued for all Q3 metrics and the gross revenue estimate may need to be adjusted.
Hiring
According to IA’s macroeconomic data, the internet industry increased hiring in Q3 by approximately 3.2 percent, demonstrating continued demand for skilled workers at internet firms. Job openings also increased by approximately 2.5 percent, though the rate of hiring dropped from the previous quarter. Total separations were up by over 12 percent indicating a net decline in industry employment. The microeconomic data also indicate the employment drop in Q3 2018. The dataset showed the total number of employees among all firms dropped by approximately 20 percent while average employment per firm dropped by 17.66 percent.
Price Drops (Digital Price Index)
Internet Association’s Digital Price Index demonstrated a drop of 15.2 percent driven by repricing two of the tracked services. The impact of the two price changes shows how there is potential for single services to impact overall expenditure levels to a large degree. IA continues to work on refining the measure to ensure an accurate and representative basket of internet services.
Changing Risk Landscape (Risk Assessment)
“Product & Services Development” remained the most-cited risk factor among internet businesses in Q3 2018 with 64.62 percent citing it among their top five risk factors overall up from 58.54 percent in Q2 2018. “Economic & Financial Conditions” remained the second most-cited risk factor with 21.54 percent of firms citing it, down from 26.34 percent from the previous quarter. “Laws and Regulation Restrictions” and “Competition” dropped out of the top five risk factors for the industry and were replaced in Q3 by “Customer Satisfaction & Subscription Rate” (13.85 percent of firm) and “Security & Data Privacy” (11.28 percent of firms).
Time & Money
Internet users increased their time online time in Q3 2018. The average American adult spent approximately three hours and two minutes online per day for personal use (i.e. not work). The figure is an increase of nearly 20 minutes over the average spent online in Q2 2018. Expected time online also increased by around the same scale – Americans expected to spend 216 minutes online in Q4 2018. Despite more time online, American adults decreased their online spending slightly with the average adult spending approximately $91.42 for personal use/services online in Q3. In Q2, average expenditure was $93.40.
Industry Leader: Public & Perception
Over the past year, IA collected proprietary data on the general public’s sentiment toward the internet industry. Internet Association issued a quarterly survey using (IA member company) SurveyMonkey to begin tracking how much time and money the general public spends online, how they prefer using the internet compared to traditional services and goods, and how they view the internet overall.
IA presents the results of that survey for Q3 2018 in this report and will do so for all quarters going forward. The most noteworthy takeaway from these metrics is that public sentiment on the internet’s contributions to society have improved every quarter over the past year.
From Q1 2018 through Q4 2018,1 IA’s general internet sentiment index ticked steadily up from 0.371 to 0.419 with increases every quarter. That is an increase of 0.048 index points over the year. Table 1 and Graph 1 show the results of IA’s sentiment index (Question 15 of the survey).
The index runs on a scale from -1 to +1. A score of -1 means survey respondents view the internet’s contributions to America as completely bad. A score of 0 (zero) is perfectly neutral, meaning equal numbers of Americans view internet’s contributions to society as bad as those that view them as good. A score of 1 means America views the internet’s contributions to society as completely good. There are three response options that are bad (negative) and three response options that are good (positive) in the question, meaning every respondent has to pick a side. IA assumes the survey captures the general population that uses the internet, but that it is not representative of individuals who are unable or choose not to use internet.
Internet Association also examined net favorability percentages among its survey respondents. The results are quite clear. The gross favorable percentage – the sum of all three positive response options – was 85.5 percent. That means 85.5 percent of Americans believe the internet’s contributions to society are at least somewhat good. The net favorability percentage – the sum of all three positive response options minus the sum of all three negative response options – was 71 percent. In other words seven in 10 Americans view the internet’s contributions to society as good even when accounting for any perceived negative aspects.
The general sentiment index parallels the trends for individual service preferences as well. IA also developed indexes to track users’ preferences between internet-delivered and traditional services for the following areas: online shopping vs brick-and-mortar shopping (Question 5); ridesharing vs using taxis (Question 6); streaming vs watching traditional TV (Question 7); using a short term rental vs staying at a hotel (Question 12); online banking vs brick-and-mortar banking (Question 13); and internet-enabled community activity vs traditional community activity (Question 14). Users have revealed through each of these questions a growing preference for internet-based services. The indexes for each of these areas improved steadily over the course of 2018 similar to IA’s general sentiment index.
The results of IA’s survey over 2018 show that users appreciate and recognized the benefits that the internet adds to the everyday lives. The indexes are simplified metrics for tracking sentiment and preferences among users over time, but they capture a large amount of nuance. The upshot is that consumers see clear benefits from using internet services.
Table 1: Internet Association’s General Sentiment Index In 2018
| Question | Q1 2018 | Q2 2018 | Q3 2018 | Q4 2018 | Qtr-Over-Qtr Change (Q2-Q3) | Q4 2018 Over Q1 2018 Change |
|---|---|---|---|---|---|---|
| How do you view the internet’s contribution(s) to society? | 0.371 | 0.373 | 0.405 | 0.419 | 0.03 | 0.048 |
Graph 1: Internet Association’s General Sentiment Index In 2018
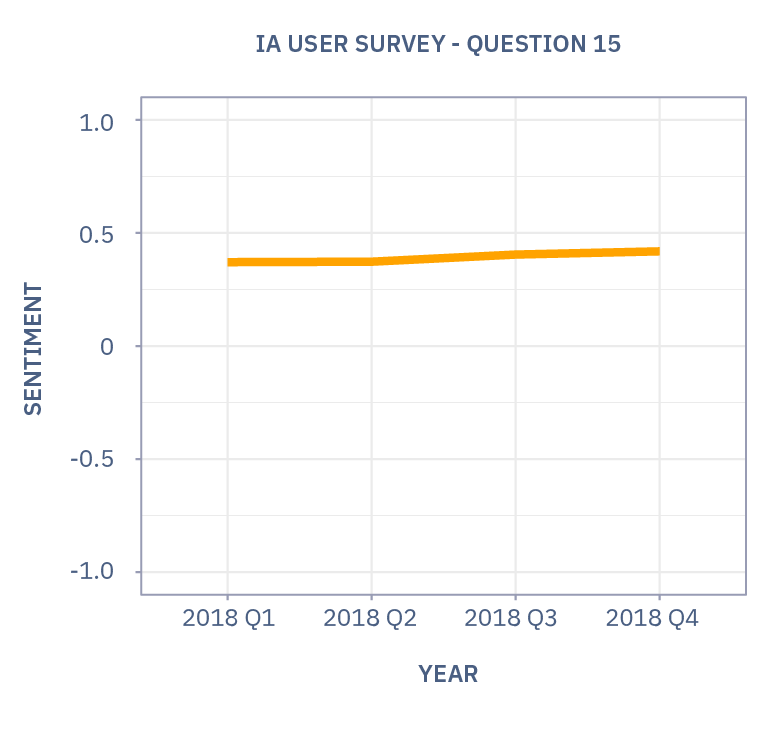
Notes: Graph shows IA’s General Sentiment Index for each quarter of 2018 based on data collected through its User Sentiment Survey.
Macroeconomic Indicators
Overview: Tables 2 and 3 provide information on the internet industry derived from North American Industrial Classification System (NAICS) codes. IA identifies the appropriate NAICS codes for inclusion through an internal identification methodology for the internet industry and the tables summarize quarter-over-quarter and year-over-year aggregate changes. See the methodology note below for more detail.
Table 2: Internet Industry Revenue
| Q2 2018 | Q2 2018 Over Q1 2018 | Q3 2018 Over Q2 2018 | Year-Over-Year Percent Change |
|---|---|---|---|
| Total Revenue (Sum) | 3.79% | -0.79% | 4.33%^^^ |
| Revenue From Businesses (Sum) | -19.7% | ^^ | -16.61%^^^^ |
| Revenue From Government (Sum) | 542.56% | ^^ | -5.43%^^^^ |
| Revenue From Households (Sum) | 1.24% | ^^ | 0.68%^^^^ |
Notes: Reports most recent quarterly figures available at time of collection. Quarterly figures for Q3 over Q2 2018 changes. IA re-reports Q2 2018 figures because of lack of data at time of previous issue debut and errors.
^Revised Q2 2018 over Q1 2018 figure from government datasets. IA confirmed calculations. Large figure may be from missing/incomplete data in government datasets from a large quarterly variation (e.g. from several large government purchases). Additional investigation needed with future data.
^^Q3 figures not reported at time of data collection.
^^^Reports figure for Q3 2018 over Q3 2017 changes.
^^^^ Reports figures for Q2 2018 over Q2 2017 change.
Table 3: Internet Industry Employment
| Qtr-Over-Qtr Percent Change | Year-Over-Year Percent Change | |
|---|---|---|
| Hires (Levels) | 3.21% | 12.72% |
| Hires (Rate) | -82.35% | -332.61% |
| Job Openings (Levels) | 2.46% | 13.58% |
| Job Openings (Rate) | -86.35% | -86.8% |
| Total Separations (Levels) | 12.17% | 12.56% |
| Total Separations (Rate) | -711.56% | 80.83% |
Notes: Reports most recent quarterly figures available at time of collection. Quarterly figures for Q3 over Q2 2018 changes. Yearly figures for Q3 2018 over Q3 2017.
Microeconomic Indicators
Overview: Table 4 provides information on the internet industry derived from information reported by publicly-traded internet companies. IA identifies the appropriate businesses through an internal identification methodology and the tables summarize quarter-over-quarter and year-over-year aggregate changes. See the methodology note below for more detail.
Table 4: Internet Industry Financial Data, Annual
| Qtr-Over-Qtr Percent Change | Year-Over-Year Percent Change | |
|---|---|---|
| Capital Expenditures (Absolute Value) | -9.57% | 13.98% |
| Capital Expenditures (Sum) | -9.57% | 23.1% |
| Market Capitalization (Sum) | -30.76% | 57.33% |
| Net Revenue (Sum) | -21.16% | 25.46% |
| Gross Revenue (Sum) | 39.42% | 22.66% |
| Employees (Sum) | -19.67% | 16.67% |
| Capital Expenditures (Average) | -7.36% | 23.1% |
| Market Capitalization (Average) | -28.97% | 53.5% |
| Net Revenue (Average) | -19.02% | 25.46% |
| Gross Revenue (Average) | 42.83% | 22.66% |
| Employees (Average) | -17.66% | 16.67% |
| Capital Expenditures (Median) | -46.34% | -8.74% |
| Market Capitalization (Median) | -26.41% | 16.91% |
| Net Revenue (Median) | -43.24% | 54.16% |
| Gross Revenue (Median) | -50.61% | 48.5% |
| Employees (Median) | -42.83% | 6.34% |
Notes: Reports most recent quarterly figures available at time of collection. Quarterly figures for Q3 over Q2 2018 changes. Yearly figures for 2017 over 2016 changes.
Digital Price Index
Overview: Table 5 provides information on Internet Association’s proprietary digital price index. The index tracks the prices of a typical basket of online, internet-based services and the table summarizes quarter-over-quarter and year-over-year aggregate changes. See the methodology note below for more detail.
Table 5: Digital Price Index
| Year-Over-Year Percent Change | Qtr-Over-Qtr Percent Change | |
|---|---|---|
| National Inflation | 2.1% | 0.33% |
| Digital Price Index | 5.28% | -15.2% |
Notes: The DPI measure uses a basket of common household internet services and products for individual consumers for which price data was available since 2013. IA collected annual prices for 2013-2017 and collects quarterly data starting in Q1 2018.
The index does not account for quality changes of services and products over time. National inflation figures come from US Bureau of Labor Statistics CPI-All Urban Consumers (Current Series).
Quarterly figures for Q3 over Q2 2018 changes. Yearly figures for 2017 over 2016 changes. IA will report year-over-year changes starting with Q1 2019 data.
Internet Industry Risk Assessment
Overview: Table 6 provides information on Internet Association’s assessment of internet industry risk factors. IA aggregates reported risks from its member companies that are publicly-traded using quarterly reports and the tables summarize reported risks for the previous quarter and year. See the methodology note below for more detail.
Table 6: Most Commonly Cited Risks to Internet Sector Companies Q2 2018
| Top 5 Internet Sector Risk Factors Q2 2018 | Percent of Risk Factor Observations |
|---|---|
| Product & Services Development | 64.62% |
| Economic & Financial Conditions | 21.54% |
| Customer Satisfaction & Subscription Rate | 13.85% |
| Market | 11.79% |
| Security & Data Privacy | 11.28% |
| Top 5 Internet Sector Risk Factors Q3 2018 | Percent of Risk Factor Observations |
| Product & Services Development | 58.4% |
| Economic & Financial Conditions | 26.34% |
| Competition | 20.98% |
| Laws & Regulation Restrictions | 15.12% |
| Market | 12.68% |
Notes: Table shows the citation frequency of the five most commonly cited risk factors for Q2 2018 and Q3 2018 among the five most important risk factors of every individual company.
Internet User Sentiment
Overview: Table 7 provides information on Internet Association’s user sentiment survey. The table reports summarized responses from a U.S. national survey of internet users and presents information on the previous two quarters as well quarter-over-quarter changes.
Table 7: Internet User Sentiment Responses
| Q# | Question | Q2 2018 | Q3 2018 | Qtr-Over-Qtr Change |
|---|---|---|---|---|
| 1^ | For personal use (i.e. not for your job/business/work), how much time on average per day do you spend using the internet? |
161.18 | 181.53 | 12.65% |
| 2^ | For personal use, how much time on average per day do you expect to use the internet over the coming three months? |
191.46 | 216.11 | 12.87% |
| 3 | Filter/quality assurance question | |||
| 8 | Do you currently use online sites, platforms, or other internet tools to pursue passion projects and/or hobbies? Examples include self-publishing a novel, selling crafts/art that you create, etc. |
31.29% | 40.99% | 9.70% |
| 9 | Is the internet essential for you to pursue these passion project(s) and/or hobby(ies)? |
26.21% | 35.18% | 8.97% |
| 10 | For personal use, how much money do you spend on average per month on all internet-based goods and services of any type? Please consider subscriptions, apps, games, shopping, movies, music, etc. |
$93.40 | $91.42 | -2.13% |
| 11 | For personal use, how much money do you expect to spend on average per month on all internet-based goods and services over the coming 3 months? |
$116.67 | $119.21 | 2.18% |
| Q# | Question^^^ | Q1 2018 | Q2 2018 | Qtr-Over-Qtr Change |
| 4 | Do you spend more time using the internet in your personal life or for your work? |
0.246 | 0.234 | -0.01 |
| 5 | Do you spend more personal money shopping online or in (‘brick and mortar’/physical) stores? |
-0.115 | -0.041 | 0.07 |
| 6 | For personal use, do you use taxis more often or do you use ridesharing apps like Lyft, Uber, Via, and others? |
0.033 | 0.059 | 0.03 |
| 7 | Do you spend more personal time watching movies, TV, and other videos online or watching them on cable/satellite? |
-0.058 | 0.053 | 0.11 |
| 12 | Do you prefer staying in hotels or short-term rentals (e.g. Airbnb, HomeAway, other vacation rentals) for personal trips? |
-0.265 | -0.252 | 0.01 |
| 13 | Do you prefer conducting your personal banking and attending to personal finances online or in a physical, ‘brick-and- mortar’ bank? |
0.076 | 0.129 | 0.05 |
| 14 | Do you prefer meeting new people through online platforms, such as Match, Tinder, etc., or through offline interactions, such as blind-dates or at parties? Please consider both romantic dating and friendships. |
-0.515 | -0.431 | 0.08 |
| 15 | How do you view the internet’s contribution(s) to society? | 0.373 | 0.405 | 0.03 |
Notes: Question 3 is a filter question to ensure quality of responses.
^Figures given in number of minutes.
^^Figures given as an index with values ranging from negative one to positive one (-1 to 1). A value of negative one (-1) indicates the worst (negative) outcome for the internet industry. A value of zero (0) indicates a neutral sentiment that is equally good and equally bad for the internet. A value of positive one (1) indicates the best (positive) outcome for the internet industry.
IA Industry Indicators (3I) Report – Methodology Notes
Overview
Identification methodologies for the internet industry, technology sector, digital economy, and other synonymous terms have received little attention from academic researchers. The primary approach used by groups to identify ‘high-tech’ industries and companies overwhelmingly rely on expert panels, where individuals subjectively select which companies/industries are or are not part of ‘tech’.
IA’s general identification methodology is primarily based on a set of NAICS codes developed by an expert panel at Economists Incorporated in 2015. The method is in line with other ‘tech sector’ and digital economy identification methodologies, such as those issued by BLS, Brookings Institute, and others. The Internet Industry Indicators Report is primarily based on that methodology with adjustments where needed, such as in the case of weighting and or lesser detail levels. Further details on each set of indicators included in the I3 report are given below:
Macroeconomic Data & Estimates
Macroeconomic data were derived from government datasets broken out by industry. IA utilized datasets for 3 to 6-digit NAICS codes based on IA’s internal identification methodology, which was developed by Economists Incorporated in 2015 using 2012 data. IA aggregated across these industry codes to develop approximations of industry totals and trends with weighted adjustments where necessary and possible.
IA Identification Methodology – Relevant NAICS Codes
| 2012 NAICS Title | IA NAICS Codes |
|---|---|
| Electronic Shopping | 45411 |
| Electronic Auctions | 454112 |
| Wireless Telecommunications Carriers (Except Satellite) | 5172 |
| Wired Telecommunications Carriers | 5171 |
| All Other Telecommunications | 517919 |
| Data Processing, Hosting, & Related Services | 518210 |
| Internet Publishing and Broadcasting & Web Search Portals | 51913 |
| Custom Computer Programming Services | 54151 |
| Computer Systems Design Services | |
| Computer Facilities Management Services | |
| Other Computer Related Services |
Microeconomic Data & Estimates
Microeconomic data were derived from publicly-traded internet companies and high-technology companies with significant internet-based revenues from a variety of sources including financial account reports, annual reports, and quarterly reports. All public IA member companies are included in this list as well as a set of other internet companies determined by IA using expert input and market analysis. IA identified 40+ publicly-traded internet companies in total at the time of data collection, which begins in the sixth week of each quarter with a one-quarter lag.
Digital Price Index Data & Estimates
IA developed its Digital Price Index using a basket of 11 internet services for which it found price data dating back to 2013. IA documented prices through online visits to the pricing detail pages of each service site using searches from its headquarters in Washington, DC. All searches are conducted on the same business day using the same computer and carried out in the sixth week of each quarter with a one-quarter lag. IA uses a 3-month average of monthly prices for this basket for quarterly estimates. The index does not account for quality changes of services and products over time. Where there are free options available for a particular service/good, IA uses the cheapest, premium subscription or per unit cost. Where there are no free options available for a particular service/good, IA uses the cheapest subscription or per unit cost. IA selected services/goods from a range of online activities to reflect a spectrum of typical online activities engaged in by users. IA emphasizes the fact that these are premium options and that many of the documented services include basic, free options as well. The current basket of services includes: Amazon Prime, Blue Apron, DropBox, Hulu, iCloud Storage, LinkedIn Premium, Netflix, New York Times, OneDrive, Spotify Premium, and Wall Street Journal. National and quarterly inflation from US Bureau of Labor Statistics CPI-All Urban Consumers (Current Series). National Inflation reports annual average 12-month percent change for each year. Quarterly inflation reports aggregated 1-month percent change (not seasonally adjusted). Quarterly figures for quarter over quarter changes. Yearly figures for year over year changes.
Risk Assessment Data & Estimates
IA develops its risk assessment utilizing 10-K and 10-Q filings from each of the public internet companies included in its microeconomic dataset. IA aggregates risk assessments from each company filing and standardizes across uniform categories of risk.
Internet User Sentiment & Estimates
IA conducts a national survey of the US general population utilizing SurveyMonkey panel service. IA runs the survey using a representative, statistically significant national sample of 1600+ respondents with no segment/demographic targeting and a 3% error margin.
Contact Us
Christopher Hooton, Ph.D.
Chief Economist & Head of Research
Internet Association
economics@internetassociation.org
The information contained herein is of a general nature and is not intended to address or identify, intentionally or unintentionally, any particular individual or entity. The information is derived using Internet Association’s internal methodologies and definitions for the internet industry to provide illustrative analysis only. Although IA attempts to provide as accurate of information as possible, there can be no guarantee that such information is accurate at any time now or in the future. The information reported is not intended as advice of any kind and Internet Association bears no responsibility for any influence from it or any decisions made as a result of the information contained herein.
- IA provides Q4 data in Table 1 and Chart 1, providing a preview of results that will come when IA issues its IA Industry Indicators report for Q4 2018 (scheduled for May 2019 release).↩