Introduction
Look around you next time you’re out. Nine out of every 10 people you see were recently on the internet. If they’re young adults, 99 out of every 100 you pass will have been online recently.1
The internet is no small phenomenon; it is arguably the most important technological and social development of the last 50 years. Its prevalence in our everyday lives and the amazing array of services and benefits that it brings to consumers are evident. It allows people to connect with loved ones, build online communities, and instantly access useful information. It is helping us solve broader global and social issues, from improving healthcare to tackling climate change. And it is providing important boosts to economies around the globe, including in the UK.
The internet is an economic engine and, in the right policy environment, will drive prosperity throughout the 21st century. Understanding and measuring these economic contributions are crucial for getting our policies right. Without an accurate assessment of the internet sector’s economic contributions – past, present, and future –, we risk making mistakes. But armed with this knowledge, we can ensure balanced policy that grows the internet’s significant benefits to society while mitigating the impact of undesirable online activity. Policymakers must remember that many people rely on online services for a range of needs, from grocery shopping to staying in touch with family to pursuing education.
Striking an appropriate balance requires contributions from all stakeholders. Internet Association has conducted a thorough set of analyses to provide estimates of the internet sector’s contribution to the UK economy. It presents them here, along with its full methodology, for public review and will continue to work with the UK Government to ensure we secure the right basis for the industry to continue to thrive. In 2016 alone, the data show the internet contributed approximately £45 billion in Gross Value Added, from nearly 80,000 businesses supporting approximately 400,000 jobs. Twenty-eight IA members have offices in the UK, contributing every day to the economy and society.
Those contributions mean the internet sector is among the most important components of the UK economy. The sector provides contributions on the same scale as economic Sections, the largest divisions of the economy according to ONS. It provides nearly the same number of enterprises to the UK as the Human health and social work activities sector. It contributes twice as much to UK value added as the Arts, entertainment and recreation sector. And it provides more than three times the combined number of jobs as mining and agriculture put together.
Internet Association views this report as its initial contribution to a new, better-informed and more balanced debate on the role of the internet in the 21st century UK economy. We look forward to working with all of those stakeholders to improve our collective understanding of the internet sector and its contributions in the UK. Understanding the contribution that the internet makes to the UK economy will ensure that decisions are taken in full knowledge of what is at stake. We hope this report can serve as another step forward in a positive and informed dialogue.
Table 1: Summary of Internet Sector Economic Contribution Estimates
| 2012 | 2016 | 5-Year Growth | Avg. Annual Growth | |
|---|---|---|---|---|
| Number of enterprises | 58,784 | 78,238 | 33.1% | 6.6% |
| Approximate gross value added at basic prices (aGVA; £ million) | 36,785 | 44,552 | 21.1% | 4.2% |
| Total employment – average during the year (thousand) | 338 | 382 | 12.8% | 2.6% |
| Total net capital expenditure (Inc NYIP) (£ million) | 5,046 | 1,918 | -62.0% | -12.4% |
Note: Figures reported from IA Methodology – USA Industry Equivalent Scenario; Note: five-year and annual growth rates are derived from raw datasets and not the rounded estimates presented here; consequently, percentages may round differently in the table. Please note that all reported figures are rounded in table (e.g. enterprises are rounded to nearest 100) and that reported 5-year growth and average annual growth percentages reflect raw figures. Rounding may cause slight discrepancies in figures in table.
Findings
This paper examines the evolution the internet sector’s economic contribution and offers more insight into the nature of those contributions over the past several years. This kind of analysis has not been attempted before.
In this section, the report provides a summary of key economic estimates for the internet sector along with national comparators. Figures 1-4 provide graphs of time series information for IA’s scenario analyses.
The report offers four key findings:
- The internet sector is a major contributor of jobs, businesses, and output to the UK economy.
- The UK internet sector has grown faster than the overall economy.
- The internet is among the largest sectors in the UK economy.
- The internet sector invests heavily in the UK economy.
IA calculates these estimates using a modification of its internal sector identification methodology developed for IA by Economists Incorporated in 2015 for the US market. The estimates in this report are mid-range figures from a variety of scenarios. Section C provides more details on the methodology.
Key Finding 1 – The Internet Sector Is A Major Contributor Of Jobs, Businesses & Output
The UK internet industry contributes2 approximately 382,000 jobs, 78,000 enterprises (businesses), and £44.6 billion in Gross Value Added to the UK’s Gross Domestic Product (GDP). These equate to about 1.2% of UK jobs, 3.1% of UK enterprises, and 2.3% of UK GDP. They also equate to approximately 1.6% of employment, 3.2% of establishments, and 3.7% of value added for the UK non-financial business economy, specifically. Table 2 summarises these figures.
These statistics provide a set of crucial reference points for understanding how the internet contributes in tangible ways to UK society.
The economic contributions of free search services, streaming music, fast delivery, and other aspects of internet services are innately understandable, but they have been harder to capture in statistics. These estimates, which IA derives from government datasets, provide the sort of base needed to appreciate the sector’s contributions now and to improve their measurement moving forward.
It is also important to note two things regarding the estimates in this report. First, IA’s estimation methodology uses a widely-accepted approach for calculating industry footprints through national statistics. While imperfect, like all estimation methodologies, the figures here are the product of an established methodology endorsed by independent third parties, and serve as an important benchmark for the internet economy.
Second, these figures are fairly conservative estimates because they focus on online digital platforms, while excluding industries like broadband. Look across other third party estimates of the UK’s internet industry’s economic footprint and you will encounter larger figures (see Dean et al., 2012 for an example; see Manyika and Roxburgh, 2011 and Hooton, 2017 for more discussion). The more conservative numbers in this report are a result of IA’s decision to use a more stringent estimation approach that excludes large portions of UK telecom activity. This decision arose from the importance of methodological consistency with IA’s US estimates and overall methodology. It is also because of different perspectives on how technology industries (e.g. the internet) should be identified and measured. IA focuses more narrowly on online, digital platforms, which represent a unique sector that will play a key role in future economic growth. To properly understand their role, these platforms require dedicated study that is separate from entities like broadband providers.
Table 2: Summary Of Internet Sector Economic Contribution Estimates
| Internet Sector 2012 | Internet Sector 2016 | UK National Total (All Industries) – 2016 | Internet As % of National (All Industries) – 2016 | UK National (A-S (Part) 2) – 2012^ | UK National (A-S (Part) 2) – 2016^ | |
|---|---|---|---|---|---|---|
| Number of enterprises | 58,784 | 78,238 | 2,554,510 | 3.1% | 1,945,158 | 2,414,695 |
| Approximate gross value added at basic prices (aGVA; £ million) | 36,785 | 44,552 | 1,970 | 2.3% | 937,039 | 1,193,185 |
| Total employment – average during the year (thousand) | 338 | 382 | 31,725^^ | 1.2% | 21,717 | 24,089 |
| Total net capital expenditure (Inc NYIP) (£ million) | 5,046 | 1,918 | 0.6% | 110,965 | 175,098 |
Note: Figures reported from IA Methodology – USA Industry Equivalent Scenario; ^Non-financial business economy; ^^Average of employment levels for All in employment for four quarters of 2016. Please note that all reported figures are rounded in table (e.g. enterprises are rounded to nearest 100) and that reported 5-year growth and average annual growth percentages reflect raw figures. Rounding may cause slight discrepancies in figures in table.
Key Finding 2 – The UK Internet Sector Has Grown Faster Than The Overall Economy
The internet industry has also grown faster than the overall UK economy. Across each of IA’s three key metrics, the internet sector outpaced the UK national economy. While this may sound intuitive to the average observer, this paper offers actual estimates of internet sector growth.
The number of internet industry enterprises in the UK grew by 33.1% between 2012-2016. That is an annual average growth rate of approximately 6.6%. The national economy, by comparison, added new enterprises at approximately 2.9% per year over that same period while the non-financial business economy saw enterprise growth of approximately 4.8% per year.
The internet sector contribution to Value Added grew by 21.1% between 2012-2016, which equates to approximately a 4.2% average annual growth rate. Similar to enterprise growth, that is more than double the national growth rate per year of approximately 2.0% for total UK productivity.
Gains in employment were more modest, but still outpaced national growth by a large amount. Internet sector employment grew by 12.8% between 2012 and 2016. The annual average growth in internet sector employment was 2.6% compared to 1.7% for all industries nationally.
These figures (summarised in Table 3 and Figures 1-3) give us a clear sense of the internet sector’s rapid growth. They also reinforce other research showing a high growth rate for the internet industry (see Hooton and Kaing, 2018). In other words, the internet has been growing rapidly and on a fundamentally different, steeper trajectory than other parts of the economy over the past five years.
Table 3: Summary Of Internet Sector Growth, 2012-2016
| Internet Sector 2012 | Internet Sector 2016 | Internet 5-Year Growth | Internet Avg. Annual Growth | UK National (All Industries) – Avg. Annual Growth | UK National (A-S (Part) 2) – Avg. Annual Growth^ | |
|---|---|---|---|---|---|---|
| Number of enterprises^^ | 58,784 | 78,238 | 33.1% | 6.6% | 2.9% | 4.8% |
| Approximate gross value added at basic prices (aGVA; £ million) | 36,785 | 44,552 | 21.1% | 4.2% | 2.0% | 5.5% |
| Total employment – average during the year (thousand) | 338 | 382 | 12.8% | 2.6% | 1.7% | 2.2% |
| Total net capital expenditure (Inc NYIP) (£ million) | 5,046 | 1,918 | -62.0% | -12.4% | 3.4% | 11.6% |
Note: Figures reported from IA Methodology – USA Industry Equivalent Scenario; ^Non-financial business economy. Please note that all reported figures are rounded in table (e.g. enterprises are rounded to nearest 100) and that reported 5-year growth and average annual growth percentages reflect raw figures. Rounding may cause slight discrepancies in figures in table.
Figure 1: UK Internet Industry Enterprises – Scenario Estimates

Figure 2: UK Internet Industry GDP – Scenario Estimates

Figure 3: UK Internet Industry Employment – Scenario Estimates
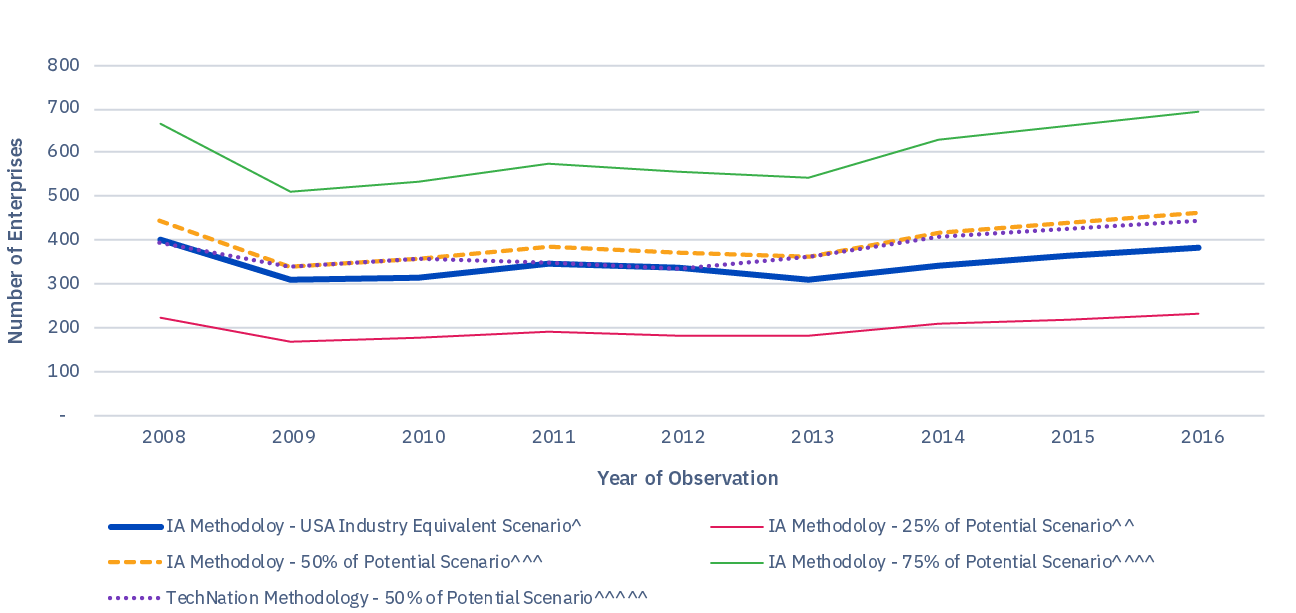
^Utilises IA industry identification methodology described in Siwek (2015); converts US industries to their UK equivalent; counts the same percentage weight of total industry output found in US industry as internet-relevant
^^Utilizes IA industry identification methodology described in Siwek (2015); converts US industries to their UK equivalent; uses 25% weight of total industry output as internet-relevant
^^^Utilises IA industry identification methodology described in Siwek (2015); converts US industries to their UK equivalent; uses 50% weight of total industry output as internet-relevant
^^^^Utilizes IA industry identification methodology described in Siwek (2015); converts US industries to their UK equivalent; uses 75% weight of total industry output as internet- relevant
^^^^Utilises TechNet (2017) industry identification methodology; converts US industries to their UK equivalent; uses 50% weight of total industry output as internet-relevant
Key Finding 3 – The Internet Is Among The Largest Sectors In The UK Economy
Context is crucial. There is a difference between simply stating numbers and placing those numbers in context so that they can be appreciated. Table 4 lays out this context, providing a ‘league’ table of the UK largest industries (Sections) with the addition of IA’s estimates for the internet sector. And in context, the UK internet sector is one of its most important, rivalling other major Sections.
The internet sector is the 9th largest out of 18 economic sectors in the UK in terms of value added. It is the 12th largest sector in terms of the number of enterprises it creates. It is the 14th largest in terms of employment.
The table shows that the internet resides solidly in the middle of the pack among all UK economic sectors. The internet industry, in other words, is just as important to the UK economy and society as the Real estate activities sector and the Accommodation and food service activities sector. It contributes twice as much to UK value added as the Arts, entertainment and recreation sector. It provides nearly the same number of enterprises to the UK as the Human health and social work activities sector. And it provides more than three times the combined number of jobs from Mining and quarrying and Agriculture, forestry and fishing.
Most importantly, this analysis shows that the internet is not a niche sub-industry dominated by only a few tech firms; rather, the internet ranks among the most important and largest Sections of the UK economy.
Perhaps most crucially, UK statistical agencies haven’t been measuring all aspects of the internet economy, leading to undercounting of the internet sector. The UK government does excellent work monitoring internet usage as well as e-commerce sales, but there are two key elements missing in the analysis. First, agencies lump online activity and information and communications technology (ICT) activity together, which oversimplifies both. Second, they have not yet translated their data into figures on the broad economic contributions of the internet. The measurements and comparisons provided here demonstrate that the lack of such figures translate into a lack of clarity regarding the relative importance of the internet industry. Again, context is crucial, particularly in policymaking.
Table 4: Putting The Internet Industry Into Context
| SIC (Revised 2007) -Section, Division, Group, Class | Description | Approximate Gross Value Added At Basic Prices (aGVA) | GVA Rank | Number Of Enterprises | Enterprises Rank | Total Employment – Average During The Year | Employment Rank | Total Net Capital Expenditure (Inc NYIP) | Capital Expenditures Rank |
|---|---|---|---|---|---|---|---|---|---|
| G | Wholesale and retail trade; repair of motor vehicles and motorcycles | 200,838 | 1 | 373,686 | 2 | 4,933 | 1 | 20,885 | 2 |
| C | Manufacturing | 166,309 | 2 | 135,756 | 7 | 2,533 | 3 | 19,260 | 3 |
| M | Professional, scientific and technical activities | 160,841 | 3 | 478,459 | 1 | 2,448 | 4 | 11,786 | 7 |
| J | Information and communication | 120,956 | 4 | 213,504 | 5 | 1,271 | 9 | 13,918 | 4 |
| N | Administrative and support service activities | 120,692 | 5 | 231,309 | 4 | 2,591 | 2 | 12,598 | 6 |
| F | Construction | 96,805 | 6 | 314,891 | 3 | 1,410 | 7 | 11,004 | 8 |
| H | Transport and storage | 80,180 | 7 | 105,064 | 9 | 1,381 | 8 | 13,430 | 5 |
| I | Accommodation and food service activities | 47,688 | 8 | 149,066 | 6 | 2,263 | 5 | 7,639 | 10 |
| Internet Industry | 44,552 | 9 | 78,238 | 12 | 382 | 14 | 1,918 | 17 | |
| L | Real estate activities | 42,689 | 10 | 93,459 | 10 | 532 | 13 | 8,619 | 9 |
| Q (Part) 2 | Human health and social work activities | 33,471 | 11 | 81,910 | 11 | 1,800 | 6 | 4,345 | 14 |
| D | Electricity, gas, steam and air conditioning supply | 26,020 | 12 | 5,017 | 17 | 141 | 16 | 22,987 | 1 |
| P (Part) 2 | Education | 22,599 | 13 | 43,100 | 14 | 1,148 | 10 | 7,127 | 13 |
| R | Arts, entertainment and recreation | 22,072 | 14 | 62,920 | 13 | 730 | 11 | 4,318 | 15 |
| E | Water supply, sewerage, waste management and remediation activities | 19,898 | 15 | 7,406 | 16 | 172 | 15 | 7,238 | 11 |
| S | Other service activities | 18,327 | 16 | 105,275 | 8 | 625 | 12 | 2,112 | 16 |
| B | Mining and quarrying | 11,677 | 17 | 1,204 | 18 | 61 | 17 | 7,175 | 12 |
| A (Part) 2 | Agriculture, forestry and fishing | 2,124 | 18 | 12,669 | 15 | 52 | 18 | 657 | 18 |
Key Finding 4 – The Internet Invests Heavily In The UK Economy
Investment is part of the reason why the internet sector has been contributing greatly and growing rapidly in the UK since 2012. The industry puts billions into its Total net capital expenditure every year. 3 IA estimates total industry capital expenditures was approximately £1.9 billion in 2016. This paper shows the cyclical nature of the internet sector’s capital expenditures in Figure 4, which masks the 2016 industry net capital expenditures as ‘low’. The figure shows that net capital expenditures reached approximately £5.5 billion in both 2011 and 2014 followed by typical reductions for one to two years before the cycle went back up. At peak investment periods between 2008 and 2016, the internet industry would have ranked 14th among all economic Sections – which are again the largest components of the UK economy – for net capital expenditures.
Figure 4: UK Internet Industry Capital Expenditures: Scenario Estimates

^Utilizes IA industry identification methodology described in Siwek (2015); converts US industries to their UK equivalent; counts the same percentage weight of total industry output found in US industry as internet-relevant
^^Utilises IA industry identification methodology described in Siwek (2015); converts US industries to their UK equivalent; uses 25% weight of total industry output as internet-relevant
^^^Utilizes IA industry identification methodology described in Siwek (2015); converts US industries to their UK equivalent; uses 50% weight of total industry output as internet-relevant
^^^^Utilises IA industry identification methodology described in Siwek (2015); converts US industries to their UK equivalent; uses 75% weight of total industry output as internet- relevant
^^^^Utilizes TechNet (2017) industry identification methodology; converts US industries to their UK equivalent; uses 50% weight of total industry output as internet-relevant.
Methodology
Internet Association conducted its analysis using its primary sector identification methodology. Economists Incorporated, led by Stephen Siwek, developed this methodology using a standard approach for industries without formal industry code assignments. Internet Association’s 2015 report, “Measuring the US Internet Sector,” provides this methodology in full for IA’s United States estimates.
In short, the methodology uses an expert review of all formal industry codes used in national statistical accounts – North American Industrial Classification System (NAICS) codes in the US case – to identify potentially internet-related industries. The method then requires an examination of the individual product line receipts reported for each industry to again identify potentially internet-related transactions. Those flagged receipts are then summed together and run through multipliers/weights to estimate specific economic metrics, such as employment.
The current report uses this same approach, but applied to the UK’s national economic statistics system. First, IA reviewed all UK Standard Industrial Classification (SIC) codes and descriptions of all Sections, Divisions, Groups, and Classes to identify equivalent UK industries for each US industry identified in Siwek (2015). As a secondary approach and comparator, IA also identified and used the list of “Digital Tech SIC Codes” named in TechNation’s report Tech Nation 2017. The list from TechNation provided methodology comparison for IA and a robustness check in the analysis. Table 5 provides the full list of relevant UK industry codes identified as IA-equivalent or listed by TechNation is given in the first column.
IA was unable to find completely equivalent industry and regional multipliers to those in its US methodology. Consequently, IA ran analysis for four scenarios using different assumptions for what percentage of each relevant industry’s activity came specifically from the internet. These were: a) 25%, b) 50%, c) 75%, and d) an IA Equivalent Industry scenario. In the 25%, 50%, and 75% scenarios, IA assumed that 25%, 50%, and 75% of each relevant industry output came from internet businesses. In the IA Industry Equivalent scenario, IA assumed the share of economic output from each relevant industry was the same as it was for its US equivalent industry. For example, if NAICS code XXXX is equivalent to SIC code ZZZZ and IA flagged 30% of XXXX’s output as coming from internet businesses, then IA assumed 30% of ZZZZ’s economic output also came from internet businesses. Conservatively, IA assumes these percentage weights remain the same in every year of observation. Internet Association used the TechNation list of industries and an assumption of 50% of activity coming from internet businesses as a fifth scenario. Table 5 again provides details.
Tables 6-9 provide the time series estimates for each of the five scenarios run in this analysis. Figures 1-4 (presented earlier) chart these estimates to provide visualisations of the internet sector’s growth over the past 10 years.
It is important to clarify some distinctions of IA’s conceptualisation of the internet. First, IA represents internet companies, but not telecommunications companies or internet-service providers (ISPs). These types of companies are obviously related to provision of the internet as a service, but they are not ‘internet companies’ according to the industry’s self-identification. This report includes several telecommunication industry codes in its list of internet-related industries; however, the analysis flags only a proportion of these code’s economic output as coming from the internet (see Table 5). This distinction also explains the discrepancy between IA’s economic output estimates (which, as stated, are conservative) and larger estimates from other groups. Many other groups include ISP activity in their ‘internet sector’ or ‘internet economy’ estimates. Second, it is important to note that the internet industry is not the same as the “digital economy” or the “technology sector”. These other two terms are similar conceptually, but broader terms. The “internet industry,” is a component of both the digital economy and technology sector. You can find further clarification in IA’s 2015 report “Measuring the US Internet Sector”.
Table 5: Internet Sector Identification And Weights
| Equivalencies | 2016 Totals For Each Metric In Each Component | |||||||
|---|---|---|---|---|---|---|---|---|
| Standard Industrial Classification (Revised 2007) – Section, Division, Group, Class | Description | Internet Association NAICS Equivalent | Pct Of Relevant IA Equivalent Industry Receipts Included?* | Included In TechNation Digital Tech list? | Number Of Enterprises In Industry | Total Approximate Gross Value Added At Basic Prices (aGVA; £ million) | Total Employment – Average During The Year (thousand) | Total Net Capital Expenditure (Inc NYIP) (£ million) |
| 62.02 | Computer consultancy activities | Computer Systems Design and Related Services, NAICS 54151 | 34% | Yes | 106,366 | 27,633 | 383 | 1,158 |
| 62.03 | Computer facilities management activities | Computer Systems Design and Related Services, NAICS 54151 | 0% | Yes | 700 | 139 | 2 | 34 |
| 62.01 | Computer programming activities | Na | 34% | Yes | 32,285 | 15,282 | 173 | 505 |
| 63.11 | Data processing, hosting and related activities | Data Processing, Hosting, and Related Services, NAICS 518210 | 46% | Yes | 3,085 | 4,254 | 36 | 348 |
| 26.2 | Manufacture of computers and peripheral equipment | Na | 0% | Yes | 867 | 716 | 0 | 20 |
| 63.9 | Other information service activities | Computer Systems Design and Related Services, NAICS 54151 | 34% | No | 3179 | 2,983 | 21 | 59 |
| 63.99 | Other information service activities n.e.c. | Computer Systems Design and Related Services, NAICS 54151 | 34% | No | 2,561 | 600 | 10 | 23 |
| 62.09 | Other information technology and computer service activities | Computer Systems Design and Related Services, NAICS 54151 | 34% | Yes | 18,765 | 10,208 | 127 | 791 |
| 58.29 | Other software publishing | Na | 0% | Yes | 2,166 | 1,225 | 0 | 100 |
| 61.9 | Other telecommunications activities | All Other Telecommunications, NAICS 517919 | 70% | Yes | 5,078 | 25,024 | 163 | 0 |
| 58.21 | Publishing of computer games | Na | 0% | Yes | 236 | 267 | 0 | 12 |
| 95.11 | Repair of computers and peripheral equipment | Na | 0% | Yes | 4,190 | 1,912 | 29 | 47 |
| 47.91 | Retail sale via mail order houses or via internet | Various – Selected Services – E-Commerce (Net Mail Order) | 69% | No | 23,577 | 5,298 | 0 | 765 |
| 61.3 | Satellite telecommunications activities | Na | 0% | Yes | 144 | -83 | 15 | 0 |
| 63.12 | Web portals | Internet Publishing and Broadcasting And Web Search Portals, NAICS 51913 | 84% | Yes | 1,251 | 1,518 | 10 | 203 |
| 61.1 | Wired telecommunications activities | Wired Telecommunications Carriers, NAICS 5171 | 29% | Yes | 1,663 | 1,065 | 0 | 58 |
| 61.2 | Wireless telecommunications activities | Wireless Telecommunications Carriers (Except Satellite), NAICS 5172 | 11% | Yes | 1,442 | 4,807 | 0 | 1,677 |
Notes: *Report ran scenarios using these percentages and with 25, 50, and 75% scenarios – i.e. the report only counted a certain percentage (e.g. 25%) of each potentially relevant industry (e.g. Web Portals) in each scenario
Table 6: Number Of Enterprises
| 2008 | 2009 | 2010 | 2011 | 2012 | 2013 | 2014 | 2015 | 2016 | |
|---|---|---|---|---|---|---|---|---|---|
| IA Methodology – USA Industry Equivalent Scenario^ | 49,879 | 48,296 | 50,270 | 55,183 | 58,784 | 64,606 | 67,104 | 72,308 | 78,238 |
| IA Methodology – 25% of Potential Scenario^^ | 33,387 | 31,598 | 32,429 | 35,383 | 37,318 | 40,826 | 42,908 | 46,621 | 49,813 |
| IA Methodology – 50% of Potential Scenario^^^ | 66,774 | 63,196 | 64,857 | 70,767 | 74,636 | 81,652 | 85,816 | 93,241 | 99,626 |
| IA Methodology – 75% of Potential Scenario^^^^ | 100,161 | 94,794 | 97,286 | 106,150 | 111,954 | 122,477 | 128,724 | 139,862 | 149,439 |
| TechNation Methodology – 50% of Potential Scenario^^^^^ | 59,276 | 56,723 | 57,293 | 62,140 | 64,266 | 69,584 | 73,936 | 80,904 | 84,968 |
Table 7: Approximate Gross Value Added At Basic Prices (aGVA; £ million)
| 2008 | 2009 | 2010 | 2011 | 2012 | 2013 | 2014 | 2015 | 2016 | |
|---|---|---|---|---|---|---|---|---|---|
| IA Methodology – USA Industry Equivalent Scenario^ | 16,799 | 34,779 | 34,030 | 35,576 | 36,785 | 38,706 | 44,056 | 42,771 | 44,552 |
| IA Methodology – 25% of Potential Scenario^^ | 11,511 | 17,755 | 17,679 | 18,506 | 19,265 | 20,387 | 22,904 | 23,564 | 24,668 |
| IA Methodology – 50% of Potential Scenario^^^ | 23,022 | 35,509 | 35,357 | 37,013 | 38,530 | 40,774 | 45,808 | 47,128 | 49,336 |
| IA Methodology – 75% of Potential Scenario^^^^ | 34,533 | 53,264 | 53,036 | 55,519 | 57,795 | 61,160 | 68,712 | 70,692 | 74,004 |
| TechNation Methodology – 50% of Potential Scenario^^^^^ | 20,202 | 32527.5 | 32,640 | 34302.5 | 35,562.5 | 37,725 | 41,824.5 | 42,878 | 44,895.5 |
^Utilises IA industry identification methodology described in Siwek (2015); converts US industries to their UK equivalent; counts the same percentage weight of total industry output found in US industry as internet-relevant
^^Utilizes IA industry identification methodology described in Siwek (2015); converts US industries to their UK equivalent; uses 25% weight of total industry output as internet-relevant
^^^Utilises IA industry identification methodology described in Siwek (2015); converts US industries to their UK equivalent; uses 50% weight of total industry output as internet-relevant
^^^^Utilizes IA industry identification methodology described in Siwek (2015); converts US industries to their UK equivalent; uses 75% weight of total industry output as internet-relevant
^^^^Utilises TechNet (2017) industry identification methodology; converts US industries to their UK equivalent; uses 50% weight of total industry output as internet-relevant
Table 8: Total Employment – Average During The Year (Thousand)
| 2008 | 2009 | 2010 | 2011 | 2012 | 2013 | 2014 | 2015 | 2016 | |
|---|---|---|---|---|---|---|---|---|---|
| IA Methodology – USA Industry Equivalent Scenario^ | 401 | 309 | 315 | 348 | 338 | 310 | 344 | 363 | 382 |
| IA Methodology – 25% of Potential Scenario^^ | 222 | 171 | 179 | 192 | 185 | 182 | 210 | 220 | 231 |
| IA Methodology – 50% of Potential Scenario^^^ | 444 | 342 | 357 | 384 | 370 | 363 | 420 | 441 | 462 |
| IA Methodology – 75% of Potential Scenario^^^^ | 665 | 513 | 536 | 576 | 555 | 545 | 629 | 661 | 692 |
| TechNation Methodology – 50% of Potential Scenario^^^^^ | 397 | 342 | 357 | 350 | 334 | 363 | 408 | 427 | 446 |
Table 9: Total Net Capital Expenditure (Inc NYIP) (£ million)
| 2008 | 2009 | 2010 | 2011 | 2012 | 2013 | 2014 | 2015 | 2016 | |
|---|---|---|---|---|---|---|---|---|---|
| IA Methodology – USA Industry Equivalent Scenario^ | 5,436 | 528 | 4,628 | 5,503 | 5,046 | 1,154 | 5,702 | 1,757 | 1,918 |
| IA Methodology – 25% of Potential Scenario^^ | 2,228 | 358 | 1,847 | 2,230 | 2,012 | 651 | 2,382 | 1,332 | 1,397 |
| IA Methodology – 50% of Potential Scenario^^^ | 4,456 | 717 | 3,693 | 4,459 | 4,024 | 1,301 | 4,765 | 2,663 | 2,794 |
| IA Methodology – 75% of Potential Scenario^^^^ | 6,683 | 1,075 | 5,540 | 6,689 | 6,036 | 1,952 | 7,147 | 3,995 | 4,190 |
| TechNation Methodology – 50% of Potential Scenario^^^^^ | 4,221 | 612 | 3,599 | 4,215 | 3,770 | 1,119 | 4,371 | 2,291 | 2,370 |
^Utilizes IA industry identification methodology described in Siwek (2015); converts US industries to their UK equivalent; counts the same percentage weight of total industry output found in US industry as internet-relevant
^^Utilises IA industry identification methodology described in Siwek (2015); converts US industries to their UK equivalent; uses 25% weight of total industry output as internet-relevant
^^^Utilizes IA industry identification methodology described in Siwek (2015); converts US industries to their UK equivalent; uses 50% weight of total industry output as internet-relevant
^^^^Utilises IA industry identification methodology described in Siwek (2015); converts US industries to their UK equivalent; uses 75% weight of total industry output as internet-relevant
^^^^Utilizes TechNet (2017) industry identification methodology; converts US industries to their UK equivalent; uses 50% weight of total industry output as internet-relevant
Previous Literature & Estimates
The following are brief summaries of key economic estimates for the internet sector or related conceptual ideas from other research. Internet Association provides them for comparative purposes and to provide context to its own estimates. All figures are cited appropriately.
- ONS (2018) estimates:
- The average internet company in the UK earns £2.64 million in revenues annually
- 270,000 UK companies (14.4% of all companies) make up the UK digital economy
- A total of 199,460 businesses made website/app sales (2015)
- 161,500 of these (81%) had fewer than 10 employees
- E-Commerce sales by businesses in the UK non-financial sector: £511 billion (2016)
- Website sales: £236 billion
- Electronic Data interchange (EDI) sales: £274 billion
- DCMS (2018a; 2018b) estimates that the digital sector contributes the following to the UK economy:
- Employment, 1.46 million (2016); 1.5 million or 4.6% (2017)
- Gross Value Added, £121.5 billion (2016); £130.5 billion or 7.1% (2017)
- AT Kearney estimates the UK Internet economy was worth £82 billion or 5.7% of GDP in 2015.
- £37 billion is from the internet value chain
- £45 billion is from e-commerce supported by the internet value chain
- £37 billion is from the internet value chain
- Max Nathan and Anna Rosso (with Tom Gatten, Prash Majmudar, and Alex Mitchell) (2013) estimate:
- The UK digital economy accounts for 11% of jobs in the country
- Digital economy firms employ 23.37 people on average compared to only 20.40 people on average for non-digital economy firms
- The UK digital economy cuts across dozens of unique industries providing jobs in everything from internet firms to aviation/aerospace
- Boston Consulting Group (Dean et al., 2012) estimated the following:
- The UK’s internet sector leads G20 countries in terms of its contribution to GDP
- 2016 estimated UK Internet sector GDP contribution: £347 billion or 12.4% of the economy
- 2010 estimated UK Internet sector GDP contribution: £187 or 8.3% of the economy
- Manyika and Roxburgh (2011) estimate the internet provides $28 of Net value per Internet user and $13 billion in Total Internet user surplus
- McKinsey (du Rausas et al., 2011) estimated the internet sector internet sector provided 23% of the UK’s GDP growth between 2004-2009, the third highest contribution among mature economies.
References & Other Research
- AT Kearney. (2015). “The Internet Economy in the United Kingdom.” Report. AT Kearney.
- Burt S., Sparks L., Teller C. (2010) “Retailing in the United Kingdom – a Synopsis.” In: Schnedlitz P., Morschett D., Rudolph T., Schramm-Klein H., Swoboda B. (eds) European Retail Research. Gabler Verlag, Wiesbaden., pp. 173 – 194, 2010.
- Clarke G., Thompson C. & Birkin M. (2015). “The emerging geography of e-commerce in British retailing”, Regional Studies, Regional Science, Vol. 2, Issue 1, pp. 371-391, 2015.
- Curran, J., Fenton, N., Freedman, D. (2016). “Misunderstanding the Internet.” London: Routledge, 2nd edition, 2016.
- (DCMS) Department for Digital, Culture, Media & Sport. (2018a). “DCMS Sectors Economic Estimates 2017: Employment.” London, United Kingdom.
- (DCMS) Department for Digital, Culture, Media & Sport. (2018b). “DCMS Sectors Economic Estimates 2017 (provisional): Gross Value Added.” London, United Kingdom.
- Dean, David, Sebastian Digrande, Dominic Field, Andreas Lundmark, James O’Day, John Pineda, and Paul Zwillenberg. (2012). “The Internet Economy in the G-20: The $4.2 Trillion Growth Opportunity.” The Connected World. BCG Report. The Boston Consulting Group. Available from: https://www.bcgperspectives.com/content/articles/media_entertainment_strategic_planning_4_2_trillion_opportunity_internet_economy_g20/
- du Rausas, Matthieu Pélissié, James Manyika, Eric Hazan, Jacques Bughin, Michael Chui, and Remi Said. (2011). “Internet matters: The Net’s sweeping impact on growth, jobs, and prosperity.” McKinsey Global Institute, McKinsey & Company. Available from: http://www.mckinsey.com/industries/high-tech/our-insights/internet-matters
- Ellis-Chadwick F., Doherty N., Hart C. (2001). “Signs of change? A longitudinal study of Internet adoption in the UK retail sector.”, Journal of Retailing and Consumer Services, Vol. 9, Issue 2, pp. 71-80, 2002.
- Garnham, N. (2005) “From cultural to creative industries.” International Journal of Cultural Policy, Vol. 11, Issue 1, pp. 15-29, 2005. DOI: 10.1080/10286630500067606.
- Giovannetti E., Kagami M., Tsuji M. (2003). “The Internet Revolution: A Global Perspective.”, Cambridge University Press.
- Hooton, C. (2017). Refreshing our understanding of the internet economy. Washington, DC: Internet Association.
- Hooton, Christopher Alex, and Davin Kaing. (2018). “Exploring Machine Learning’s Contributions to Economic Productivity and Innovation.” The International Journal of Technology, Knowledge, and Society 14 (3): 1-25. doi:10.18848/1832-3669/CGP/v14i03/1-25.
- Johnston D., Wade M., McClean R. (2007). “Does e-Business Matter to SMEs? A Comparison of the Financial Impacts of Internet Business Solutions on European and North American SMEs.”, Journal of Small Business Management, Vol. 45, Issue 3, 2007.
- Kneller, R. and J. Timmis. (2016). “ICT and Exporting: The Effects of Broadband on the Extensive Margin of Business Service Exports.”, Review of International Economics, Vol. 24, Issue 4, pp. 757-796, 2016.
- Kuk G.(2003). “The digital divide and the quality of electronic service delivery in local government in the United Kingdom.”, Government Information Quarterly, Vol. 20, Issue 4, pp. 353-363, 2003.
- Lawrence, J. (2008). “The challenges and utilization of e-commerce : use of Internet by small to medium-sized enterprises in the United Kingdom.”, Information, society and justice journal, Vol. 1, Issue 2, pp. 99-113, 2008.
- Manyika J., Roxburgh C. (2011). “The great transformer: The impact of the Internet on Economic Growth and Prosperity.” McKinsey Global Institute, 2011.
- Nathan, Max and Anna Rosso (with Tom Gatten, Prash Majmudar, and Alex Mitchell). (2013). “Measuring the UK’s Digital Economy with Big Data.” National Institute of Economic and Social Research.
- OECD (2008), “Statistics, Knowledge and Policy 2007: Measuring and Fostering the Progress of Societies”, OECD Publishing, 2008.
- OECD. (2013). “Measuring the Internet Economy: A Contribution to the Research Agenda”. OECD Digital Economy Papers, No. 226, OECD Publishing. Available from: http://dx.doi.org/10.1787/5k43gjg6r8jf-en
- (ONS) Office for National Statistics. (2018). “IT and internet industry.” Online. Available at: https://www.ons.gov.uk/businessindustryandtrade/itandinternetindustry.
- Oulton N. (2002). “ICT and Productivity Growth in the United Kingdom.” Oxford Review of Economic Policy, Volume 18, Issue 3, pp. 363–379.
- Pohjola M. (2002). “The New Economy: facts, impacts and policies.” Information Economics and Policy, Vol 14, Issue 2, pp. 133-144, 2002.
- Pring, P., L. Nolan, and H. Bovill. (2014). “Changes to the Annual Business Survey, the Quarterly Survey of Capital Expenditure and the Survey into Business Spending on Capital Items, in 2015.” 22 August 2014. Office for National Statistics.
- Silverstein, B. D. (2000). “Business-to-Business Internet Marketing: Seven Proven Strategies for Increasing Profits through Internet Direct Marketing.”, Maximum Press, 4th edition, 2002.
- Siwek, Stephen F. (2015). “Measuring the U.S. Internet Sector”. Internet Association. Washington, DC. Available from: http://internetassociation.org/wp-content/uploads/2015/12/Internet-Association-Measuring-the-US-Internet-Sector-12-10-15.pdf