There are approximately 3 billion people in the global workforce. LinkedIn’s vision is to create economic opportunity for every one of them. The development of the world’s first Economic Graph will lead to making that vision a reality. This, of course, is no easy task. Our vision is grand, but it’s not unattainable.

So, here’s the challenge: Given the wealth of data that exists within LinkedIn, what research would you propose that has the potential to create greater economic opportunity?
We are launching the LinkedIn Economic Graph Challenge to encourage researchers, academics and data-driven thinkers to solve some of the most challenging economic problems of our times.
Together, we believe we can effectively remove barriers to economic growth and create opportunity for every member of the global workforce.
Learn more about the LinkedIn Economic Graph Challenge
What is the Economic Graph?
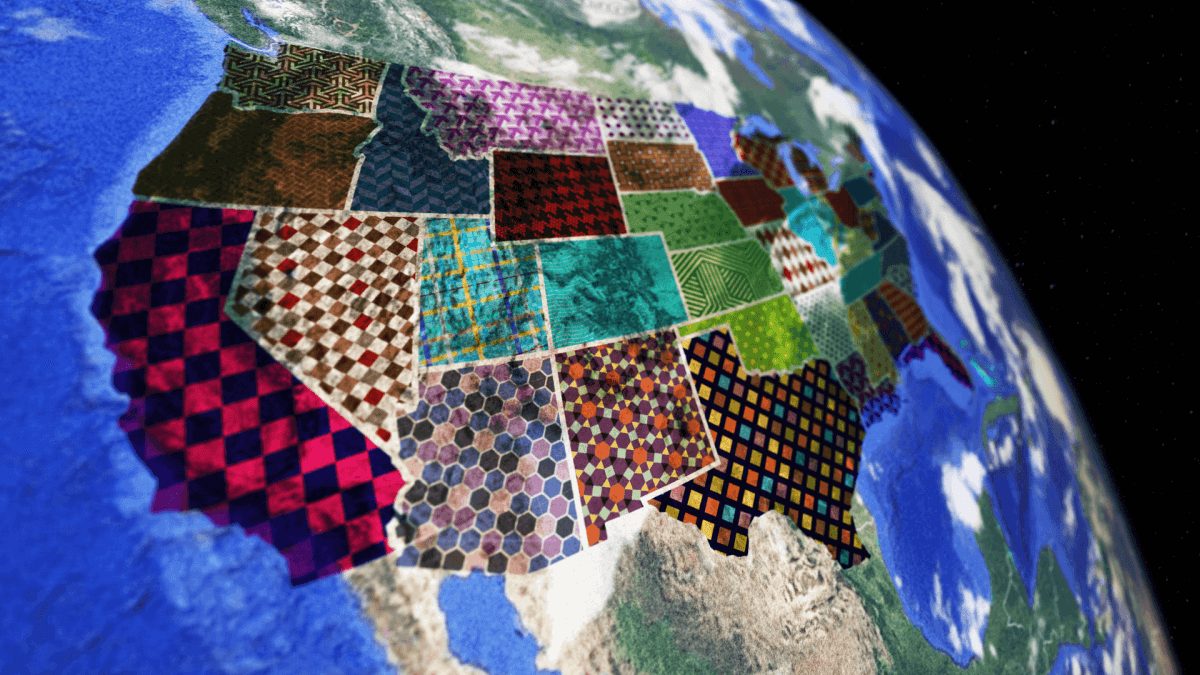
The Economic Graph is, in short, a digital mapping of the global economy. It will include a profile for every one of the 3 billion members of the global workforce, enabling them to represent their professional identity and subsequently find and realize their most valuable opportunities. It will include a profile for every company in the world, who you know at those companies up to three degrees to help you get your foot in the door, and the product and services those companies offer to enable you to be more productive and successful. It will digitally represent every economic opportunity offered by those companies, full-time, temporary and volunteer, and every skill required to obtain those opportunities. It will include a digital presence for every higher education organization in the world that can help members obtain those skills. And it will overlay the professionally relevant knowledge of every one of those individuals, companies, and universities to the extent that they want to publicly share it. Learn more about the Economic Graph and join the discussion.
To read more, click here.


