Executive Summary
IA presents new estimates on the size of the internet sector in the U.S. economy as of 2018, the most recent year data is available. The results show the internet sector contributed 10.1 percent of U.S. GDP and 4.0 percent of jobs (non-farm employment). IA estimates the internet sector supported another over 13.1 million indirect jobs and that the sector invested over $60 billion into the economy. The report also lays out a new methodology that IA will use to conduct these estimates on an annual basis going forward. Table 1 provides a summary of key results.
Table 1: Summary Results
| National References | Volumes | Percent of U.S. Total |
|---|---|---|
| 2018 National GDP (Millions) | $20,494,100 | 100% |
| 2018 National Employment | 150,275,000 | 100% |
| Internet Sector Estimates | ||
| 2018 Internet Sector Value-Added (Millions) | $2,070,642 | 10.10% |
| 2018 Internet Sector Direct Employment | 5,948,115 | 4.00% |
| 2018 Internet Sector Indirect Supported Jobs | 13,084,566 | 8.70% |
Finding #1 – The internet sector contributed $2.1 trillion to U.S. GDP.
IA estimates the internet sector contributed $2.1 trillion to the U.S. economy in 2018, which equates to 10.1 percent of U.S. GDP. This is more than twice the output volume than the internet contributed to the economy in 2014, which was approximately $966 billion.
Finding #2 – The internet sector created 6 million direct jobs to the U.S. economy, double the number in 2014.
Direct employment levels in the internet sector have grown dramatically since 2014, increasing to 6 million direct jobs in 2018. This is equal to about 4 percent of U.S. employment. Output to employment ratios have historically been lower in the industry, given the high productivity and efficiency of the sector (based on its use of cutting-edge technologies). But the internet sector is now maturing and rapidly creating hundreds of thousands of new jobs.
Finding #3 – The internet sector supported another 13.1 million indirect jobs in other areas of the economy.
Apart from direct jobs, the internet sector supported another 13.1 million jobs in the U.S., the equivalent of roughly 8.7 percent of total U.S. employment.
Finding #4 – The internet sector supports 2 indirect jobs for every 1 direct job it creates.
With over 13 million indirect jobs compared to 6 million direct jobs, the internet sector demonstrates strong positive downstream effects for the economy.
Finding #5 – The internet sector has doubled in size twice in the past decade. The internet sector has undergone staggering growth since 2007.
The results of this study show the internet sector has doubled in size (in terms of value-added and employment) since 2014. That builds on the previous growth between 2007 and 2012 when it doubled as well. Total internet sector revenues increased at an annual compound growth rate of 23.4 percent between 2012-2018. Internet sector value-added contributions grew by approximately 470 percent since 2007.
Finding #6 – The internet sector grew nine times faster than the U.S. economy as a whole between 2012-2018.
The growth of the internet sector far surpasses national growth. The U.S. total GDP grew by 41.8 percent between 2007-2018, from $14.5 trillion to $20.5 trillion. The internet sector grew about 372 percent, from about $438.8 billion in value-added to about $2.1 trillion, nine times faster than total GDP during that period, For additional comparison, the Information sector and Manufacturing sector grew by 59.3 percent and 26.6 percent, respectively, over the same period. The internet sector, therefore, grew more than six times faster than the Information sector and 14 times faster than the Manufacturing sector in that period. Figure 1 and Figure 2 illustrate this growth.
Finding #7 – The internet sector invested over $60 billion into the economy in 2018.
U.S. internet sector companies invested $64 billion in the U.S. economy through capital expenditures. IA’s members alone invested over $42 billion.
Finding #8 – The internet sector is now the fourth largest sector in the U.S. economy.
The internet sector’s $2.1 trillion in value-added makes up 10.1 of U.S. GDP. That puts it as the fourth largest economic sector in the country behind only “Real estate, rental, and leasing,” “Public Administration (Government),” and “Manufacturing.”
Introduction
Internet Association’s founding in 2012 signaled the explicit recognition of the internet’s importance for the United States economy. As a trade association serving as the unified voice of the internet economy, IA provided new focus and guidance on how we understand the internet’s value.
IA’s 2015 report,1 “Measuring the U.S. Internet Sector,”(referred to going forward as the “2015 report”) detailed the economic contributions of the internet in the U.S. and demonstrated the internet’s new (at that time), but established role as an economic sector. It was a novel, but overdue look at the internet’s economic role and it helped us realize just how far the internet had evolved since its infancy in the late 20th century.
The 2015 report also showed how far behind we were in terms of accurately measuring the internet. We used data from 2007 and 2012 to develop estimates of the U.S. internet sector’s economic footprint for 2014. We were able to use data that were several years old to forecast the sector’s economic contributions, but the methodology only allowed for accurate updates approximately every five years.2 It has consequently been four years since we first released our flagship economic report and seven years since we have had up-to-date data for new estimates.
To address these challenges, we have developed an adapted approach to its sector measurement methodology that will now allow for annual updates to its U.S. internet sector footprint estimates. The method follows the same principles and basic approach as our 2015 inaugural report, thus preserving methodological consistency. However, our approach now utilizes big data sources, blending its standard input-output approach with a microeconomic dataset to provide a timelier picture of the internet economy. In short, we can now produce estimates on the size of the internet sector every year and with only a delay of approximately six months.
The results are exciting and staggering. The internet sector was responsible for approximately $2.1 trillion of value-added, or 10.1 percent of U.S. gross domestic product (GDP) in 2018. The value-added contributions continued the same incredible growth rates of previous years, more than doubling in volume between 2012 and 2018 (similar to its doubling between 2007 to 2012). The internet contributed approximately six million jobs to the American economy, about 4.0 percent of total employment in 2018 and more than twice the number in 2014. And internet companies spent over $64 billion on capital investments in the U.S. economy, providing a key source of investment into the economy.
These new numbers provide an up-to-date benchmark for the internet sector’s economic contributions, but they also tell a more important story. The internet sector’s importance to the U.S. economy continues to increase rather than leveling. The growth of new industries typically lessens over time. They grow rapidly at first, but then move into marginal year-over-year increases as the sector matures. We are not seeing this same pattern with the internet sector. The internet sector has doubled in terms of economic output twice in approximately the last decade alone. This is not a result of our new measurement approach (the numbers remain consistent between methodologies as we show later). Nor are there signs of it slowing down. Internet sector companies continue to drive economic growth in the U.S. while simultaneously encouraging older industries to innovate and update in order to compete. The result is that the internet is now the fourth largest economic sector and a central engine of the U.S. economy.3
This report, Measuring the U.S. Economic Sector: 2019, provides our newest measurements on the economic contributions of the internet for 2018 and formally kicks off our new and improved flagship report. We will follow this year’s report with annual updates going forward to provide crucial information to policymakers, researchers, and the general public about the value and contributions of the internet. We invite you to read the report and look forward to providing regular updates in the future.
Overview Of The Internet Sector
Defining The Internet
The starting point for understanding the internet sector is to distinguish it from the internet as a technology. The Cambridge Dictionary defines the internet as “the large system of connected computers around the world that allows people to share information and communicate with each other.”4 The technology is ubiquitous, with nine out of 10 U.S. adults and 98 percent of those between the ages of 18-50 using the internet and 73 percent of adults with access to high-speed broadband service at home.5
Individuals and organizations use the internet to conduct a wide range of activities that produce value and which comprise the internet economy (or digital economy).6 The Organization for Economic Cooperation and Development defines the internet economy as “the full range of our economic, social and cultural activities supported by the Internet and related information and communications technologies” (OECD 2008).7 The BEA recently estimated that the digital economy accounted for approximately $1.35 trillion (6.9 percent) of GDP and 5.1 million (3.3 percent) of U.S. employment in 2017.8
The core of the internet economy is the internet sector, which consists of businesses that utilize online commerce for their primary lines of business. This narrower group leaves out ‘traditional’ companies that may engage in limited online activity (e.g. a shoemaker having an online store) and is the group that IA represents on matters of public policy.9 We define the internet sector as the set of businesses engaged primarily in the production, distribution, and or processing of products and services through online platforms and applications. In its 2015 report, we estimated the internet sector contributed approximately $1 trillion in value-added to U.S. GDP and 3 million jobs to total national employment.
Identifying Internet Industries
Researchers have typically measured both the internet economy and internet sector using a macroeconomic input-output approach. This process relies on a group of experts selecting the specific industries within a country that are relevant to the internet and then identifying the specific business receipts within those industries that are relevant to the internet. It relies on the use of North American Industrial Classification System (NAICS),10 which consists of 2- to 6-digit hierarchical codes and which classifies all economic/business activity in the U.S. into one of 403 unique 6-digit codes. These 6-digit codes are aggregated up into larger groupings. For example, a 6-digit code forms a part of a 2-digit code – the last four digits identify the subcategory of the 2-digit code.
We identified eight specific NAICS subindustries (as well as a set of “Selected Services – E-Commerce”) that comprised the internet sector in its 2015 report based on the 2012 NAICS vintage. Table 2 shows the subindustries identified in the 2015 report, recreating the previous report’s Table A-4.
Table 2: NAICS Industry Classifications That Include Internet Activities
| NAICS Code | Industry Title |
|---|---|
| Product Line Receipts | |
| 518210 | Data processing, hosting and related services |
| 5171 | Wired Telecommunications carriers |
| 5172 | Wireless telecommunications carriers (except satellite) |
| 517919 | All Other Telecommunications |
| 51713 | Internet publishing and broadcasting and Web Search Portals |
| 54151 | Computer Systems Design and related services |
| E-Commerce Retail | |
| 45411 | Electronic shopping |
| 454112 | Electronic Auction |
| Selected Services | |
| Various | Selected Services ? E-Commerce |
Source: Internet Association; categories from U.S. Census Bureau, American Fact Finder
We then used these codes to identify relevant gross receipts from specific Product Line Statistics by Industry from national accounts data. The specific flagged receipts represent the specific commercial activity within these NAICS codes that occurred on the internet. The information came from the 2012 and 2007 Economic Censuses.
The codes listed in Table 2, along with the specific product lines flagged as relevant, comprise the operational definition of the internet sector for the purposes of measuring the internet’s economic footprint.
Methodology
Our functional definition of the internet sector follows a standard practice for measuring ‘non-traditional’ industries that do not currently have a dedicated NAICS code(s). However, there is a key issue with the 2015 methodology and indeed other input-output methodologies that rely on a selection of lower level industries. The functional definition from our 2015 methodology uses data that receive full updates only every five years with the issuance of the Economic Census. The gap prevents accurate estimates in interim years, as evidenced by the previously mentioned lack of update to our internet sector estimates since 2015 and the use of 2012 data to form its 2014 estimates. The most recent Economic Census took place in 2017, but the necessary data for our previous methodology will not arrive until late 2020.
We have thus worked on an alternative approach over the past three years and have identified a robust method for doing so. The new approach still follows the input-output model, but sources a substitute for the gross product line receipt volumes (the key input) through a comprehensive microeconomic dataset. The key difference is the use of gross revenues from all relevant internet businesses in place of gross receipts from relevant internet subindustries.
Updating And Converting IA’s NAICS Codes
The first step in our new approach is to update the industry codes identified in 2015 to the 2017 NAICS vintage. Every five years, in conjunction with the Economic Census, government agencies revise and update the definitions and numeric codes of NAICS industries.
The second step is to then trace the 2017 NAICS codes to their equivalent Standard Industrial Classification (SIC) codes.11 We uses microeconomic data from the “Financial Statement Data Sets” from the Securities and Exchange Commission (SEC) for this new method and these data provide SIC codes for each business rather than NAICS codes.
The SEC Financial Statement Data Sets “provide numeric information from the face financials of all financial statements” filed by participating companies.12 They are, in short, financial data for all publicly-traded companies that choose to file them. Their key advantage is that the SEC issues them quarterly and with a lag of only about two quarters. This allows us to provide estimates on the internet sector’s footprint in the previous year approximately six months after the conclusion of that year (e.g. releasing estimates for 2018 in mid-2019).
The conversion of NAICS codes to SIC codes can be done using formal crosswalks issued by the Census Bureau. Doing so allows us to identify internet-relevant businesses following the same input-output approach we used in 2015.
Table 3 provides the NAICS update and conversion to SIC codes. It details how the flagged industries in its 2015 report convert into the 2017 NAICS vintage and into SIC codes.
Table 3: Converting 2012 Internet NAICS Codes
| 2017 NAICS Code | 2017 NAICS Title | 2012 NAICS Code | 2012 NAICS Title | IA Internet Sectors | SIC Code |
|---|---|---|---|---|---|
| 519130 | Internet Publishing and Broadcasting and Web Search Portals | 519130 | Internet Publishing and Broadcasting and Web Search Portals | 51913 | 2711 |
| 2721 | |||||
| 2731 | |||||
| 2741 | |||||
| 2771 | |||||
| 517312 | Wireless Telecommunications Carriers (except Satellite) | 517210 | Wireless Telecommunications Carriers (except Satellite) | 5172 | 4812 |
| 4812 | |||||
| 517311 | Wired Telecommunications Carriers | 517110 | Wired Telecommunications Carriers | 5171 | 4813 |
| 4822 | |||||
| 4841 | |||||
| 517919 | All Other Telecommunications | 517919 | All Other Telecommunications | 517919 | 4899 |
| 4899 | |||||
| 454110 | Electronic Shopping and Mail-Order Houses | 454111 | Electronic Shopping | 45411 | 5961 |
| 454110 | Electronic Shopping and Mail-Order Houses | 454112 | Electronic Auctions | 454112 | 5961 |
| 541511 | Custom Computer Programming Services | 541511 | Custom Computer Programming Services | 54151 | 7371 |
| 541512 | Computer Systems Design Services | 541512 | Computer Systems Design Services | 7373 | |
| 541513 | Computer Facilities Management Services | ||||
| 541519 | Other Computer Related Services | ||||
| 518210 | Data Processing, Hosting, and Related Services | 518210 | Data Processing, Hosting, and Related Services | 518210 | 7374 |
| 7375 | |||||
| 7375 | |||||
| 541513 | Computer Facilities Management Services | 7376 | |||
| 7379 | |||||
| 7379 | |||||
| 541519 | Other Computer Related Services | 7379 | |||
| 7389 | |||||
| 8999 | |||||
| 8999 | |||||
| 8999 |
Source: Author’s elaboration; Information from Census Bureau. Note: Some SIC codes are repeated because they correspond to interim NAICS vintage from 2012, 2007, 2002, and or 1997. The process requires step-by-step conversion through each vintage.
Flagged Product Line Receipts
We next recorded the total Revenues from all businesses classified in the relevant SIC codes shown in Table 3 using the SEC data. This figure serves as the ‘input’ into our new estimation method.
Crucially, total revenues from individual companies and gross receipts for an industry are conceptually the same – in theory, the gross receipts reported in national account product lines should include every individual company’s gross revenues under that industry code.13 So, the gross revenues from all internet-relevant companies should equal the gross receipts from all internet-relevant subindustries. This allows us to use revenues (rather than product line receipts) as the primary input into its input-output model and, thus, allows us to bypass the five-year delays in Economic Census updates.
We also note that the data for the E-Commerce industries (NAICS 45411 and 454112) and Selected Services – E-Commerce were updated to 2018 and 2017 respectively, thus allowing us to draw on the official government data directly for those lines (rather than relying on the SEC data). Table 4 provides the total and flagged gross receipt amounts for 2007 and 2012, according to its 2015 report for historical comparison with our previous method.
Table 5 provides the total revenues (receipts) volume for 2018 using its new approach and the SEC datasets. Table 5 also provides flagged revenue volumes for two scenarios: a primary estimation procedure and a conservative estimation procedure.
Table 4: Internet Sector Receipts and Shares of Industries – 2007 and 2012
| 2017 NAICS Code | 2017 NAICS Title | Total Receipts 2007 | Internet Share 2007 | Internet Receipts 2007 | Total Receipts 2012 | Internet Share 2012 | Internet Receipts 2012^ |
|---|---|---|---|---|---|---|---|
| 519130 | Internet Publishing and Broadcasting and Web Search Portals | $31,094 | 96.60% | $30,029 | $86,853 | 84.30% | $73,230 |
| 517312 | Wireless Telecommunications Carriers (except Satellite) | $170,584 | 3.20% | $5,406 | $226,010 | 11.00% | $24,794 |
| 517311 | Wired Telecommunications Carriers | $290,781 | 23.00% | $66,744 | $285,080 | 29.40% | $83,937 |
| 517919 | All Other Telecommunications | $13,456 | 46.80% | $6,301 | $14,373 | 70.40% | $10,116 |
| 454110 | Electronic Shopping and Mail-Order Houses | $65,200 | 38.10% | $24,800 | $157,600 | 37.10% | $58,500 |
| 454110 | Electronic Shopping and Mail-Order Houses | ||||||
| 541511 | Custom Computer Programming Services | $244,389 | 37.50% | $91,533 | $332,246 | 33.90% | $112,569 |
| 541512 | Computer Systems Design Services | ||||||
| 541513 | Computer Facilities Management Services | ||||||
| 541519 | Other Computer Related Services | ||||||
| 518210 | Data Processing, Hosting, and Related Services | $66,652 | 30.40% | $20,232 | $104,154 | 45.60% | $47,481 |
| Selected Services and E-Commerce | $124,100 | 75.70% | $94,000 | $366,300 | 83.50% | $305,800 | |
| Total | $1,006,256 | $339,045 | $1,572,616 | $716,427 | |||
Note: Author uses exact figures reported in IA’s 2015 report, but internet share percentages are rounded and internet receipt totals may not precisely equal corresponding rounded percent amount.
^ Internet share refers to 2018 total electronic shopping and mail order retail net minus mail order sales (e-commerce sales) based on 2017 share of online vs mail order shares and multiplied by Adjusted Gross Margin percentage for 2018
Table 5: Internet Sector Receipts and Shares of Industries – 2018
| 2017 NAICS Code | 2017 NAICS Title | Total Revenues/ Receipts 2018 | Internet Revenues/ Receipts (Primary) | Internet Share 2018^ (Primary)^^ | Internet Revenues/ Receipts 2018 (Conservative) | Internet Share 2018 (Conservative) ^^^ |
|---|---|---|---|---|---|---|
| 519130 | Internet Publishing and Broadcasting and Web Search Portals | $17,746 | $13,817 | 77.90% | $11,648 | 84.30% |
| $10,281 | $8,005 | $6,748 | ||||
| $330 | $257 | |||||
| $217 | ||||||
| 517312 | Wireless Telecommunications Carriers (except Satellite) | $21,946 | $5,945 | 27.10% | $654 | 11.00% |
| 517311 | Wired Telecommunications Carriers | $469,073 | $160,932 | 34.30% | $47,314 | 29.40% |
| $1,661 | $570 | $168 | ||||
| $535,440 | $183,701 | $54,008 | ||||
| 517919 | All Other Telecommunications | $1,643 | $1,506 | 91.70% | $1,0617 | 0.40% |
| 454110 | Electronic Shopping and Mail-Order Houses | $512,579 | $210,670 | 41.10% | $210,670 | 41.10% |
| 454110 | Electronic Shopping and Mail-Order Houses | |||||
| 541511 | Custom Computer Programming Services | $5,353 | $1,710 | 31.90% | $580 | 33.90% |
| 541512 | Computer Systems Design Services | $69,720 | $22,274 | $7,551 | ||
| 541513 | Computer Facilities Management Services | |||||
| 541519 | Other Computer Related Services | |||||
| 518210 | Data Processing, Hosting, and Related Services | $150,269 | $89,079 | 59.30% | $40,620 | 45.60% |
| $331,064 | $196,255 | $89,492 | ||||
| Selected Services and E-Commerce | $1,004,250 | $826,105 | 82.30% | $826,105 | 82.30% | |
| Total | $3,131,355 | $1,720,826 | $1,296,835 | |||
Note: Internet share percentages are rounded and internet receipt totals may not precisely equal corresponding rounded percent amount. The blank portions of the table reflect the tracing of SIC code to NAICS code – in certain cases, SIC codes were consolidated or split out into their NAICS equivalent as the system was updated. Please refer to Table 3 to identify the specific SIC codes.
^ Internet share refers to 2018 total electronic shopping and mail order retail net minus mail order sales (e-commerce sales) based on 2017 share of online vs mail order shares and multiplied by Adjusted Gross Margin percentage for 2018
^^ Assumes growth rate between 2012 and 2017 was half of previous 5-year growth rate between 2007 and 2012. E-commerce and selected services lines have exact changes documented because of federal government data
^^^ Assumes no growth in internet share of respective subindustry totals since 2012.
Growth Scenarios
The primary disadvantage of our new estimation approach is the lack of product line details that would allow us to classify particular receipts as internet-related or not. In other words, we cannot determine the share of total revenues that came specifically from internet-related activity versus the share that came from non-internet activities for each individual business in the SEC data. We address this by running two estimation procedures.
The primary approach examines the change in the ‘internet share’ of each industry code between 2007 and 2012 and then assumes that the change in share between 2012 and 2018 was half of the previous amount (weighted for six years rather than five years). Put simply, we assumed internet activities between 2012 and 2018 grew at half their previous five-year growth rate between 2007 and 2012. This approach also allows for negative growth, such as in the case of “Internet Publishing and Broadcasting and Web Search Portals.”
The conservative approach, on the other hand, assumes there was no growth in the share of internet-related activities between 2012 and 2018 – i.e. the share of receipts flagged in our 2015 report remained the same. This is a conservative approach, because there is ample research and data indicating continued strong growth in the internet sector since 2012 and it is highly likely that the proportion of internet-related commercial activity would have increased in the internet-relevant NAICS industries over that period. Again, Table 5 shows the assumed flagged revenue shares for both scenarios.
Multipliers And Economic Measurements
With internet-related revenues calculated (i.e. the input metric), we then developed a set of multipliers for determining Value-Added, Direct Employment, and Total Employment (our key outputs). We described the specific procedures for determining the multiplier amounts in our 2015 report,14 partially using RIMS II multipliers from BEA, and we use the same multipliers here from our 2015 report. While the previous multipliers are outdated by several years, they offer more nuance by using a weighted averaging technique (for selected states) that we cannot reproduce in the current paper.
We also run a second robustness test using current multipliers by using the overall averages for all states plus the District of Columbia (rather than weighted averages of selected states), which is presented later in Section 5.5. Given the minimal differences between the two multiplier approaches and the more conservative estimates produced by not weighting the multipliers according to the concentration of internet-relevant industries in certain states, we use the implied multipliers from its 2015 report in our primary estimation.
Table 6 in Section 5 presents the flagged revenues and multipliers used in our estimates while Table 13 (also in Section 5) offers the alternative multipliers.
Results
We first published information on the economic contributions of the internet sector in the U.S. five years ago. Since the release of that research, we have continued to study the internet sector and refine its measurement approaches to ensure all stakeholders are aware of the value of the internet sector. This report is the first to update the core, benchmark figures for the size of the sector and the first to do so with current information.
The Economic Footprint Of The Internet
The results from this update show the U.S. internet sector produced over $1.7 trillion in revenues/receipts in 2018. These revenues contributed approximately $2.1 trillion in value-added to the U.S. economy or about 10.1 percent of U.S. GDP. The internet sector was responsible for employing 6 million employees directly, which is approximately 4.0 percent of all U.S. employment. The internet sector also indirectly supported another 13.1 million jobs, or approximately 8.7 percent of national employment. Table 6 details these figures and their inputs for each industry. Again, for reference, we estimated in the 2015 report that the internet sector contributed approximately $1 trillion of value-added (6 percent) and 3 million jobs (2.1 percent) in 2014.
Table 6: U.S. Internet Sector Economic Footprint – 2018 – Primary Estimates (Millions of $)
| 2017 NAICS Code | Total Flagged Receipts 2018 (primary) | Implied Multiplier – VA | Implied Multiplier – Direct Emp. | Implied Multiplier – Total Emp. | VA (primary) | Direct Emp. 2018 (primary) | Total Emp. 2018 (primary) |
|---|---|---|---|---|---|---|---|
| 519130 | $13,817 | 1.3785 | 5.2769 | 15.0165 | $19,047 | 72,911 | 207,482 |
| $8,005 | $11,034 | 42,239 | 120,201 | ||||
| $257 | $355 | 662 | 3,864 | ||||
| 517312 | $5,945 | 1.1113 | 2.573 | 9.0951 | $6,606 | 15,296 | 54,068 |
| 517311 | $160,932 | 1.1086 | 2.499 | 8.8076 | $178,409 | 402,169 | 1,417,426 |
| $570 | $632 | 1,424 | 5,018 | ||||
| $183,701 | $203,651 | 459,070 | 1,617,968 | ||||
| 517919 | $1,506 | 1.1149 | 2.3458 | 8.4815 | $1,680 | 3,534 | 12,777 |
| 454110 | $210,670 | 1.2509 | 4.0102 | 12.2256 | $263,527 | 844,829 | 2,575,567 |
| 454110 | |||||||
| 541511 | $1,710 | 1.372 | 2.3826 | 15.3719 | $2,346 | 4,074 | 26,287 |
| 541512 | $22,274 | $30,560 | 53,070 | 342,391 | |||
| 541513 | |||||||
| 541519 | |||||||
| 518210 | $89,079 | 1.1207 | 2.5794 | 8.9369 | $99,831 | 229,771 | 796,094 |
| $196,255 | $219,943 | 506,220 | 1,753,910 | ||||
| Selected Services and E-Commerce | $826,105 | 1.2509 | 4.0102 | 12.2256 | $1,033,375 | 3,312,846 | 10,099,629 |
| Total | $1,720,826 | $2,070,996 | 5,948,115 | 19,032,681 |
Internet Sector Growth
The updated estimates for 2018 presented here show that the internet sector has doubled in size since 2014, in just four years. Total internet sector revenues increased at an annual compound growth rate of 23.4 percent between 2012-2018. Internet sector value-added contributions increased at an annual compound growth rate of 19.1 percent between 2012-2018. Since 2007, which is the earliest year for which IA has measurements, the internet sector has nearly quintupled in size, increasing its value-added contributions by approximately 470 percent.
The growth of the internet sector has also far surpassed national growth. The U.S. total GDP grew by 41.8 percent between 2007-2018, from $14.5 trillion to $20.5 trillion. The internet sector grew nine times faster than total GDP during that period.
For additional comparison, the Information sector and Manufacturing sector grew by 59.3 percent and 26.6 percent, respectively, over the same period. The internet sector, therefore, grew more than six times faster than the Information sector and 14 times faster than the Manufacturing sector in that period. Figure 1 and Figure 2 illustrate this growth. Figure 1 shows the historic volumes of the Manufacturing sector and Information sector from 1947 to 2018 compared to the historic volumes of the internet sector since 2007 (the earliest estimate IA has). The graph helps illustrate the dramatic rise in value-added from the internet in just over a decade. Figure 2 illustrates the growth rates of the internet compared to overall GDP growth, the Manufacturing sector, and the Information sector. It helps illustrate how the internet sector has far outpaced other components of the U.S. economy.
Figure 1: Internet Sector Value-Added Volumes With Comparators, 1947-2018

Source: Author’s elaboration; data from BEA
Figure 2: Internet Sector Value-Added Growth With Comparators, 2007-2018
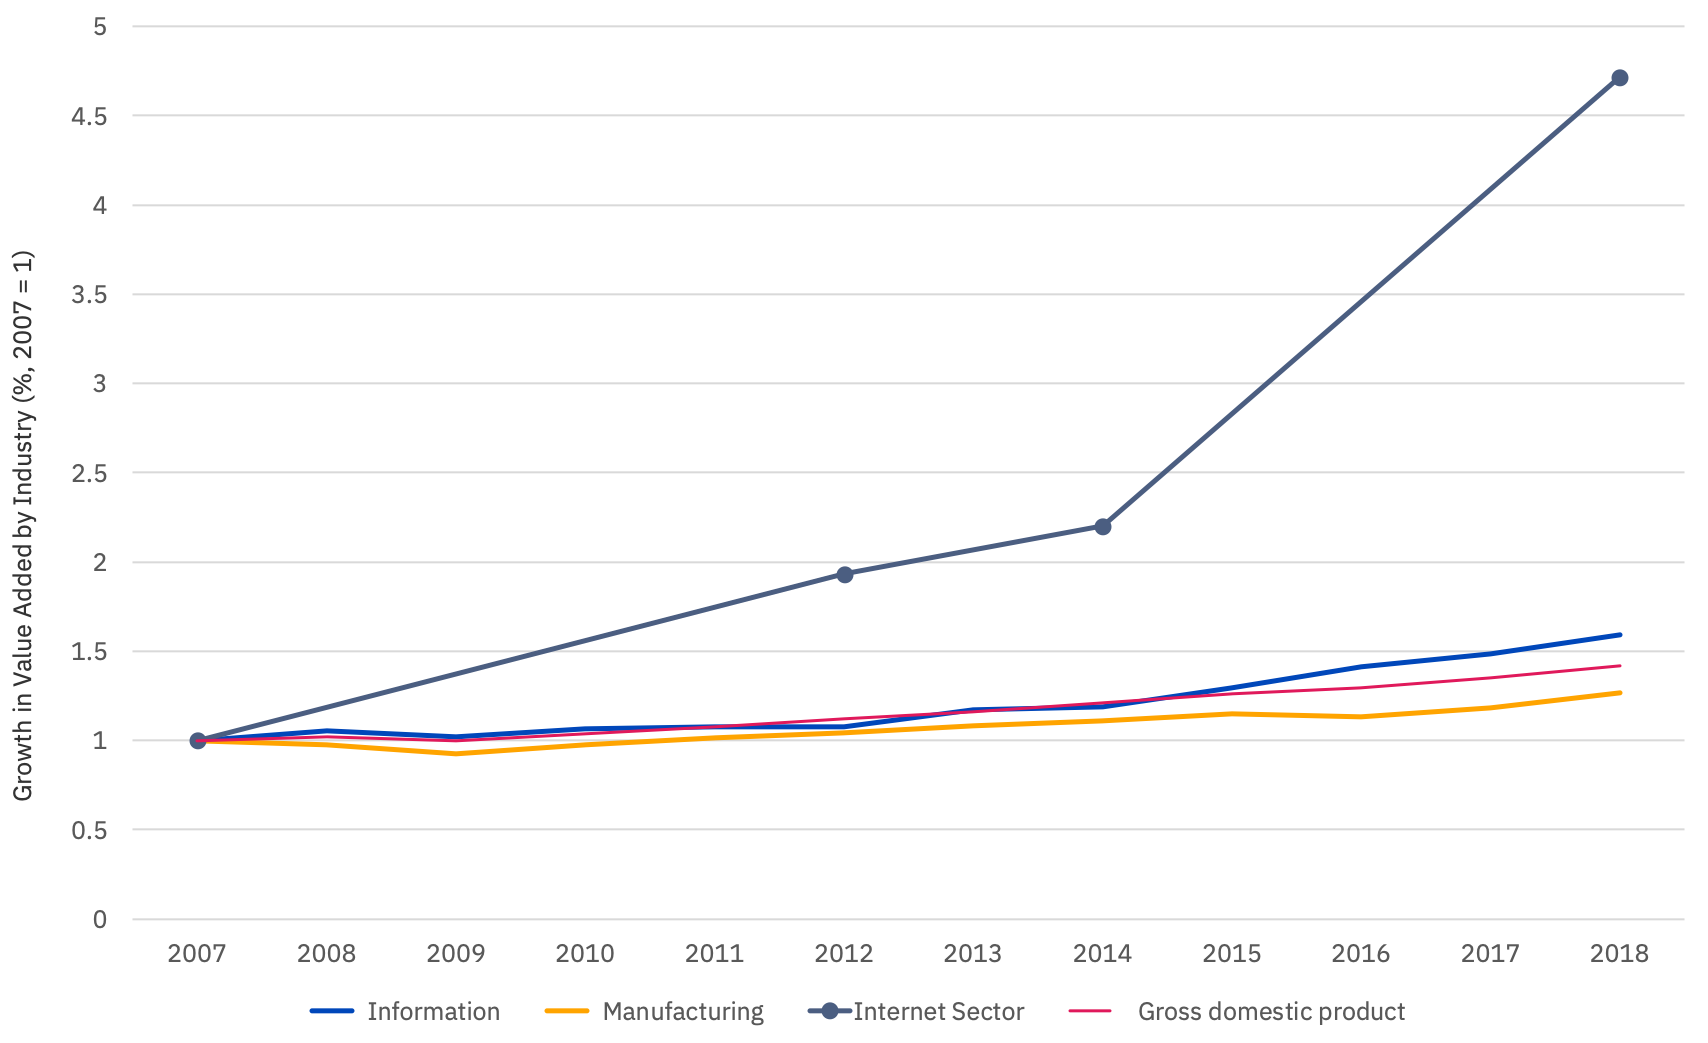
Source: Author’s elaboration; data from BEA
Investment
An additional advantage of our new measurement approach is the ability to estimate internet sector investment into the economy. Our 2015 report could not provide an estimate for this, but we can now aggregate capital expenditures from internet sector companies. Researchers commonly use capital expenditure as a proxy for investment by a company.
We have three estimates for internet sector investment in 2018, which it presents in Table 7. First, the SEC database showed a total of approximately $4.4 billion in New Capital Expenditures Incurred But Not Yet Paid in 2018 by all internet-relevant companies.15 For the second and third estimates, we draw on one of our robustness tests, the details of which it presents in later in this section. We identified a set of ‘known’ internet sector companies using its membership list, former members, and their competitors and manually aggregated financials from publicly-available company reports. Using this approach, we found that our current membership invested approximately $42.3 billion in 2018 and that U.S. internet companies invested approximately $64.2 billion in 2018.16
Table 7: Internet Sector Investment
| 2018 Total New Capital Expenditures Incurred But Not Yet Paid | $4,361,596,000 |
| 2018 Total Capital Expenditures Using Manual Report Collection ? IA members | $42,336,980,000 |
| 2018 Total Capital Expenditures Using Manual Report Collection ? US Internet Companies Only | $64,201,077,000 |
Comparing Internet Sector With Other Sectors
Finally, it is important to contextualize the estimates IA provides in this report. It is one thing to know the volume and percentage of the internet sector’s economic footprint; it is another thing to appreciate what they mean.
IA compares the internet sector with the major NAICS sectors in Table 8. The table shows the internet sector now constitutes the fourth largest economic sector in the U.S., behind only “Real estate, rental, and leasing”, “Public Administration (Government)”, and “Manufacturing”. Furthermore, Table 8 demonstrates the internet sector’s steady and rapid increases in its share of contributions to the U.S. economy since 2007.
Table 8: Comparing Internet Sector With Other Sectors – Percentage Of National GDP (%)
| 2018 Rank | NAICS | Sector Name | 2007 | 2012 | 2018 |
|---|---|---|---|---|---|
| 1 | 53 | Real Estate Rental and Leasing | 12.6 | 13 | 13.3 |
| 2 | 92 | Public Administration (Government) | 13.1 | 13.3 | 12.2 |
| 3 | 31-33 | Manufacturing | 12.8 | 11.9 | 11.4 |
| INTERNET SECTOR 2018 | 10.1 | ||||
| 4 | 54 | Professional, Scientific, and Technical Services | 6.8 | 7.3 | 7.6 |
| 5 | 52 | Finance and Insurance | 7.1 | 7.2 | 7.4 |
| 6 | 62 | Health Care and Social Assistance | 6.5 | 7.4 | 7.4 |
| 7 | 42 | Wholesale Trade | 5.9 | 6.2 | 6 |
| 8 | 44-45 | Retail Trade | 6 | 5.6 | 5.5 |
| INTERNET SECTOR 2012 | 5.54 | ||||
| 9 | 51 | Information | 4.9 | 4.7 | 5.5 |
| 10 | 23 | Construction | 4.9 | 3.4 | 4.1 |
| 11 | 48-49 | Transportation and Warehousing | 2.9 | 2.9 | 3.2 |
| 12 | 56 | Administrative and Support and Waste Management and Remediation Services | 3 | 2.9 | 3.1 |
| INTERNET SECTOR 2007 | 2.94 | ||||
| 13 | 72 | Accommodation and Food Services | 2.7 | 2 | 3 |
| 14 | 81 | Other Services (except Public Administration) | 2.3 | 2.1 | 2.1 |
| 15 | 55 | Management of Companies and Enterprises | 1.7 | 1.9 | 1.9 |
| 16 | 21 | Mining | 2.2 | 2.2 | 1.6 |
| 17 | 22 | Utilities | 1.6 | 1.7 | 1.6 |
| 18 | 61 | Educational Services | 1 | 1.3 | 1.2 |
| 19 | 71 | Arts, Entertainment, and Recreation | 1 | 1.1 | 1.1 |
| 20 | 11 | Agriculture, Forestry, Fishing and Hunting | 1 | 1.1 | 0.8 |
Source: Author’s elaboration; data from IA and BEA, Value-Added by Industry as a Percentage of Gross Domestic Product, Release Date: April 19, 2019
Robustness Tests
Our primary estimation procedure assumed that the growth rate in its subindustries of the internet sector from 2012-2018 was one half of the growth rate in its subindustries for the sector between 2007-2012 (weighted for a six-year period versus five-year period). The results up to now have been for that scenario.
We also undertook several alternative analyses to ensure the quality of its primary estimates. This section details those analyses and help illustrate the robustness of our primary estimation methodology.
Conservative Scenario
We first ran an alternative scenario in which the internet sector did not grow within its subindustries between 2012-2018. This scenario assumed the flagged receipt shares for each component industry of the internet sector remained the same in 2018 as it was in 2012. This assumption is highly conservative given the volume of research showing clear growth in the internet over that six-year period. However, we perform this exercise since it is unable to determine the specific revenues that were internet-related in the SEC dataset (see Section 4.3).
Table 9 presents the results for this more conservative scenario while Table 10 provides a summary comparison between it and our primary estimates. In this conservative scenario, we estimate the internet sector contributed approximately $1.6 trillion to U.S. GDP (7.8 percent), 4.9 million direct jobs (3.2 percent), and supported an additional 10.3 million indirect jobs (10.1 percent).
| 2017 NAICS Code | Total Revenues/ Receipts 2018 | Implied Multiplier – VA | Implied Multiplier – Direct Emp. | Implied Multiplier – Total Emp. | VA 2018 (Conservative) | Direct Emp. 2018 (Conservative) | Total Emp. 2018 (Conservative) |
|---|---|---|---|---|---|---|---|
| 519130 | $17,746 | 1.3785 | 5.2769 | 15.0165 | $16,056 | 61,464 | 174,907 |
| $10,281 | $9,302 | 35,608 | 101,329 | ||||
| $330 | |||||||
| $299 | 1,145 | 3,257 | |||||
| 517312 | $21,946 | 1.1113 | 2.573 | 9.0951 | $727 | 1,683 | 5,947 |
| 517311 | $469,073 | 1.1086 | 2.499 | 8.8076 | $52,452 | 118,238 | 416,723 |
| $1,661 | $186 | 419 | 1,475 | ||||
| $535,440 | $59,873 | 134,967 | 475,683 | ||||
| 517919 | $1,643 | 1.1149 | 2.3458 | 8.4815 | $1,182 | 2,488 | 8,995 |
| 454110 | $512,579 | 1.2509 | 4.0102 | 12.2256 | $263,527 | 844,829 | 2,575,567 |
| 454110 | |||||||
| 541511 | $5,353 | 1.372 | 2.3826 | 15.3719 | $795 | 1,381 | 8,911 |
| 541512 | $69,720 | $10,360 | 17,991 | 116,071 | |||
| 541513 | |||||||
| 541519 | |||||||
| 518210 | $150,269 | 1.1207 | 2.5794 | 8.9369 | $45,523 | 104,776 | 363,019 |
| $331,064 | $100,294 | 230,836 | 799,783 | ||||
| Selected Services and E-Commerce | $1,004,250 | 1.2509 | 4.0102 | 12.2256 | $1,033,375 | 3,312,846 | 10,099,629 |
| Total | $3,131,355 | $1,593,952 | 4,868,668 | 15,151,297 |
Table 10: Summary of Results by Scenario
| National References | Volumes | Percent of U.S. Total | |
|---|---|---|---|
| 2018 National GDP (Millions) | $20,494,100 | 100% | |
| 2018 National Employment | 150,275,000 | 100% | |
| Recommended Estimate | |||
| 2018 Internet Sector Value-Added | $2,070,642 | 10.10% | |
| 2018 Internet Sector Direct Employment | 5,948,115 | 4.00% | |
| 2018 Internet Sector Total Employment | 19,032,681 | 12.70% | |
| Conservative Estimate | |||
| 2018 Internet Sector Value-Added | $1,593,952 | 7.80% | |
| 2018 Internet Sector Direct Employment | 4,868,668 | 3.20% | |
| 2018 Internet Sector Total Employment | 15,151,297 | 10.10% | |
Source: Author’s elaboration
Alternative Multipliers
We also ran an analysis in which it used alternative multipliers for value-added, direct employment, and total employment. In its primary scenario, we used the same implied multipliers calculated in the 2015 report. These multipliers used weighted averages based on subindustry concentrations across U.S. states and provided a nuanced picture to the output effects of internet sector economic activity.
In this current alternative scenario, we used the most recent industry input-output multipliers available from BEA (i.e. we updated the multipliers). However, we were unable to use the same weighted average approach and, consequently, used the average output multiplier for all U.S. states (plus DC) for value-added, direct employment, and total employment. The advantage of this approach is that the multipliers are more recent than those used in our primary analysis. The disadvantage is that the calculations are cruder in the primary output calculations.
We believe the benefits of its primary approach outweigh those of this current alternative scenario. As an illustrative example, the distortion from weighing the Alaska and California the same for the internet sector is greater than the time distortion of using older versus newer multipliers separated by a few years. We include the alternate scenario here for thoroughness in Table 11.
Using the alternate scenario with updated multipliers, we estimate that the internet sector contributed $1.99 trillion in value-added, 5.4 million direct jobs, and 16.3 million indirect jobs. Their respective shares of national totals are: 9.7 percent (VA), 3.6 percent (direct jobs), and 10.8 percent (indirect jobs).
Table 11: U.S. Internet Sector Economic Footprint – 2018 – Primary Estimates (Millions of $)
| 2017 NAICS Code | Total Flagged Receipts 2018 (primary) | Implied Multiplier – VA | Implied Multiplier – Direct Emp. | Implied Multiplier – Total Emp. | VA (Primary) | Direct Emp. 2018 (Primary) | Total Emp. 2018 (Primary) |
|---|---|---|---|---|---|---|---|
| 519130 | $13,817 | 1.045 | 3.7038 | 7.6882 | $14,439 | 51,175 | 106,227 |
| $8,005 | $8,365 | 29,647 | 61,541 | ||||
| $257 | $269 | 525 | 1,978 | ||||
| 517312 | $5,945 | 1.1149 | 2.0396 | 11.6678 | $6,628 | 12,125 | 69,362 |
| 517311 | $160,932 | 1.1149 | 2.0396 | 11.6678 | $179,423 | 328,237 | 1,877,724 |
| $570 | $635 | 1,162 | 6,648 | ||||
| $183,701 | $204,809 | 374,677 | 2,143,391 | ||||
| 517919 | $1,506 | 1.1149 | 2.0396 | 11.6678 | $1,680 | 3,073 | 17,577 |
| 454110 | $210,670 | 1.033 | 1.8554 | 19.1255 | $217,622 | 390,877 | 4,029,168 |
| 454110 | |||||||
| 541511 | $1,710 | 1.312 | 2.2946 | 15.6632 | $2,244 | 3,924 | 26,785 |
| 541512 | $22,274 | 1.2401 | 2.2597 | 9.4593 | $27,622 | 50,332 | 210,695 |
| 541513 | |||||||
| 541519 | |||||||
| 518210 | $89,079 | 1.0234 | 2.9597 | 10.575 | $91,164 | 263,648 | 942,015 |
| $196,255 | $200,847 | 580,855 | 2,075,394 | ||||
| Selected Services and E-Commerce | $826,105 | 1.2509 | 4.0102 | 12.2256 | $1,033,375 | 3,312,846 | 10,099,629 |
| Total | $1,720,826 | $1,989,120 | 5,403,104 | 21,668,135 |
Manual Collection Alternative
In a final robustness test, we manually collected financials from the annual reports of publicly-traded internet companies. We identified these companies by using our current membership list, a list of former members, and a list of industry competitors (as identified by IA). We aggregated totals for gross revenue, employment, and capital expenditures (see Section 5.2).
The purpose of this additional exercise was to provide an intuitive check on our primary estimates using a different, but similar aggregation approach. It also allowed us to collect information on internet sector investment.
Table 12 shows the revenue totals for our primary estimate and using this alternative approach for all manually identified U.S. internet companies and for our member companies only. The table also shows the estimate from our 2015 report for internet sector gross receipt totals in 2012 and for 2012 internet sector revenue totals using our current, primary estimation approach.
This exercise demonstrates the reliability of our new methodology. The total revenue estimate using the manual collection was $1.658 trillion versus the revenue estimate from the primary approach of $1.720 trillion. The difference is about 3.5 percent and the manual collection estimate is lower (as expected). For 2012, our new methodology produces a revenue estimate of $816.0 billion versus the previous estimate of $716.4 billion. The difference is about 14 percent – larger than the manual report check, but still within the same “ballpark.” It is also important to emphasize that the new methodology used in this report includes financial information that would have been potentially revised since 2015 and that the assigned SIC codes may have changed. So, greater variation is expected in this final check.
Table 12: Robustness Check – Revenue
| 2018 Total U.S. Revenue Primary Estimate | $1,720,826,000,000 |
| 2018 Total Revenue Using Manual Report Collection ? IA members | $1,657,495,940,000 |
| 2018 Total Revenue Using Manual Report Collection ? U.S. Internet Companies Only | $596,823,169,000 |
| 2012 Total Revenue Using SEC Filers | $815,982,900,000 |
| 2012 Total Revenue From Siwek (2015) | $716,400,000,000 |
Source: Author’s elaboration
Table 13: Robustness Check – Employment
| 2018 Total U.S. Internet Sector Direct Employees | 5,948,115 |
| 2018 Total Employees Using Manual Report Collection – IA Members Only |
1,102,879 |
| 2018 Total Employees Using Manual Report Collection – U.S. Internet Companies Only |
1,052,135 |
| 2012 Total Revenue Using SEC Filers | $815,982,900,000 |
| 2012 Total Revenue From Siwek (2015) | $716,400,000,000 |
Source: Author’s elaboration
Conclusion
We present our new estimates for the size of the U.S. internet sector in 2018 in this report. We calculate the internet sector contributed 10.1 percent of U.S. GDP and 4.0 percent of jobs (from direct employment alone). We estimate the internet sector supported another invested over 13.1 million indirect jobs and that the sector invested over $60 billion into the economy. We have developed a new methodology that now allows it to conduct these estimates on an annual basis going forward.
Questions? Contact: economics@internetassociation.org
Internet Sector Economic Impact State By State
- Stephen Siwek at Economists Incorporated authored the report on behalf of IA.↩
- This relates to the 2015 report’s methodology, which relied on the Bureau of Economic Analysis’s (BEA) five-year comprehensive updates to its Benchmark Input-Output Accounts. These occurred in 2007, 2012, and 2017; however, the 2017 data releases lag by one to several years.↩
- Behind only “Real estate, rental, and leasing”, “Public Administration (Government)”, and “Manufacturing.”↩
- https://dictionary.cambridge.org/dictionary/english/internet↩
- Pew Research Center. “Internet/Broadband Fact Sheet.” February 5, 2018. Available at: https://www.pewinternet.org/fact-sheet/internet-broadband/↩
- Researchers and stakeholders often use these terms interchangeably.↩
- OECD. 2008. The Seoul Declaration for the Future of the Internet Economy, Ministerial session, 18 June 2008, Available at: http://www.oecd.org/internet/consumerpolicy/40839436.pdf (accessed 29 March 2012).↩
- BEA. 2019. “Measuring the Digital Economy: An Update Incorporating Data from the 2018 Comprehensive Update of the Industry Economic Accounts.” Online Report. Bureau of Economic Analysis.↩
- See https://internetassociation.org/our-members/ for a current list of IA member companies↩
- The Census Bureau defines NAICS as, “the standard used by Federal statistical agencies in classifying business establishments for the purpose of collecting, analyzing, and publishing statistical data related to the U.S. business economy.” See: https://www.census.gov/eos/www/naics/↩
- SIC codes are a system for classifying industries using a four-digit code. NAICS codes replaced SIC codes in 1997; however, businesses continue to use/receive a SIC classification.↩
- See: https://www.sec.gov/dera/data/financial-statement-data-sets.html↩
- See https://www.census.gov/newsroom/press-releases/2016/cb16-tps08.html↩
- Briefly, we essentially used a weighted average of the industry and regional multipliers in 2015 based on the state-specific multipliers for the selected internet industries (NAICS) for the states that collectively employed 60 percent of total U.S. employment in each industry.↩
- New capital expenditures incurred represent new investment decisions made in the current time period rather than old actualization of older investment decisions. It is important to emphasize that many investment decisions are made several years in advance of actual expenditures↩
- Please note that IA represents several international (i.e. non-U.S. headquartered) companies and that IA does not represent every single internet company in the U.S.↩